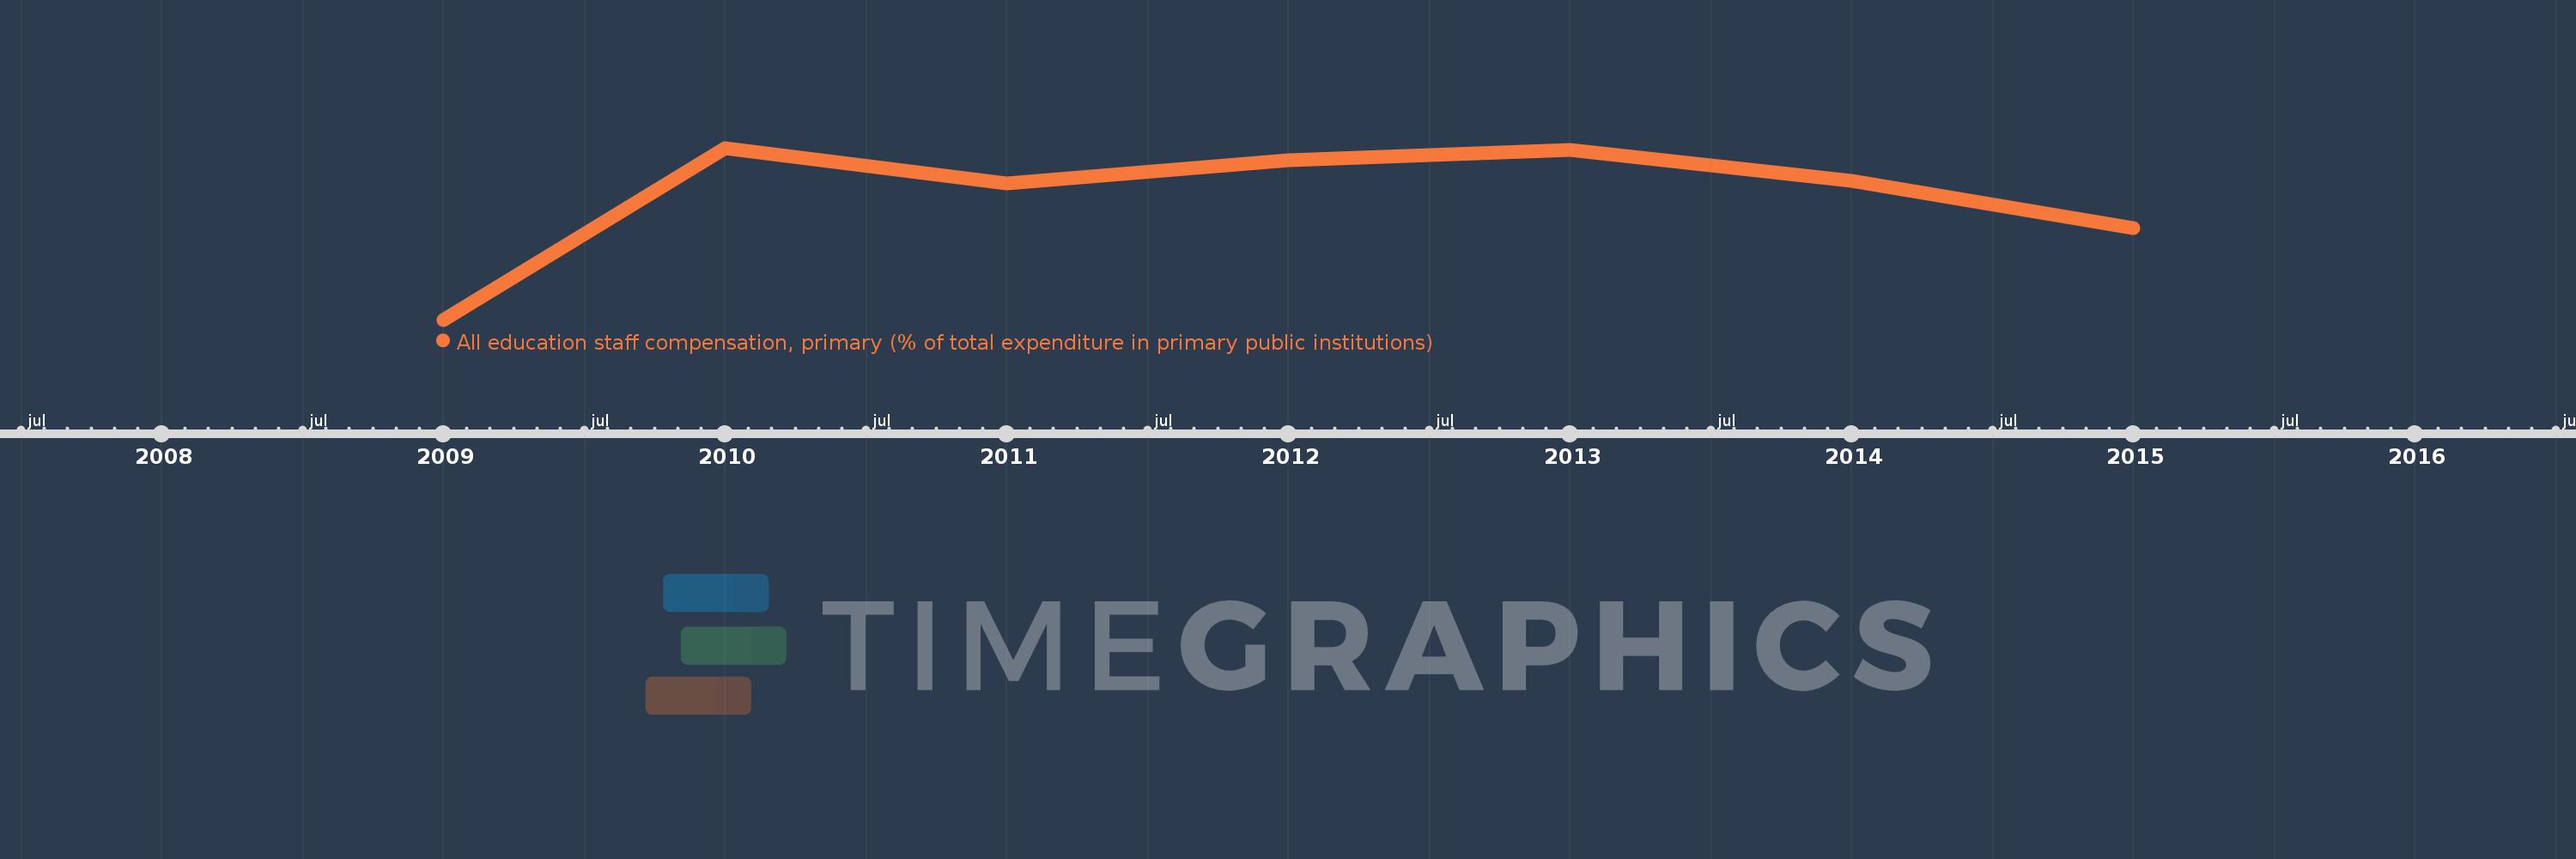
Questa scala temporale mostra un grafico dal 2009 anno al 2015 anno. Moldova. I dati fino ad 2008 anno non disponibili. Il numero di osservazioni attuali secondo i date: 7.
La fonte (nome):
Indicatori dello sviluppo mondiale
La fonte (organizzazione):
United Nations Educational, Scientific, and Cultural Organization (UNESCO) Institute for Statistics.
Categorie:
Education
sono stati aggiornati
23 apr 2017 anni
Indicatori delle variazioni dei valori per anni
In media:
62.825
Minima:
56.625
1 gen 2009 anni
Massimo:
65.218
1 gen 2010 anni
Alla data di osservazione
Valore
Variazione assoluta
La variazione rispetto al valore precedente
1 gen 2009 anni
56.625
+56.625
0.0%
1 gen 2010 anni
65.218
+8.593
15.17%
1 gen 2011 anni
63.448
-1.77
-2.71%
1 gen 2012 anni
64.589
+1.141
1.8%
1 gen 2013 anni
65.138
+0.55
0.85%
1 gen 2014 anni
63.564
-1.574
-2.42%
1 gen 2015 anni
61.191
-2.374
-3.73%
Classificazione dei paesi secondo i statistiche attuali per anni