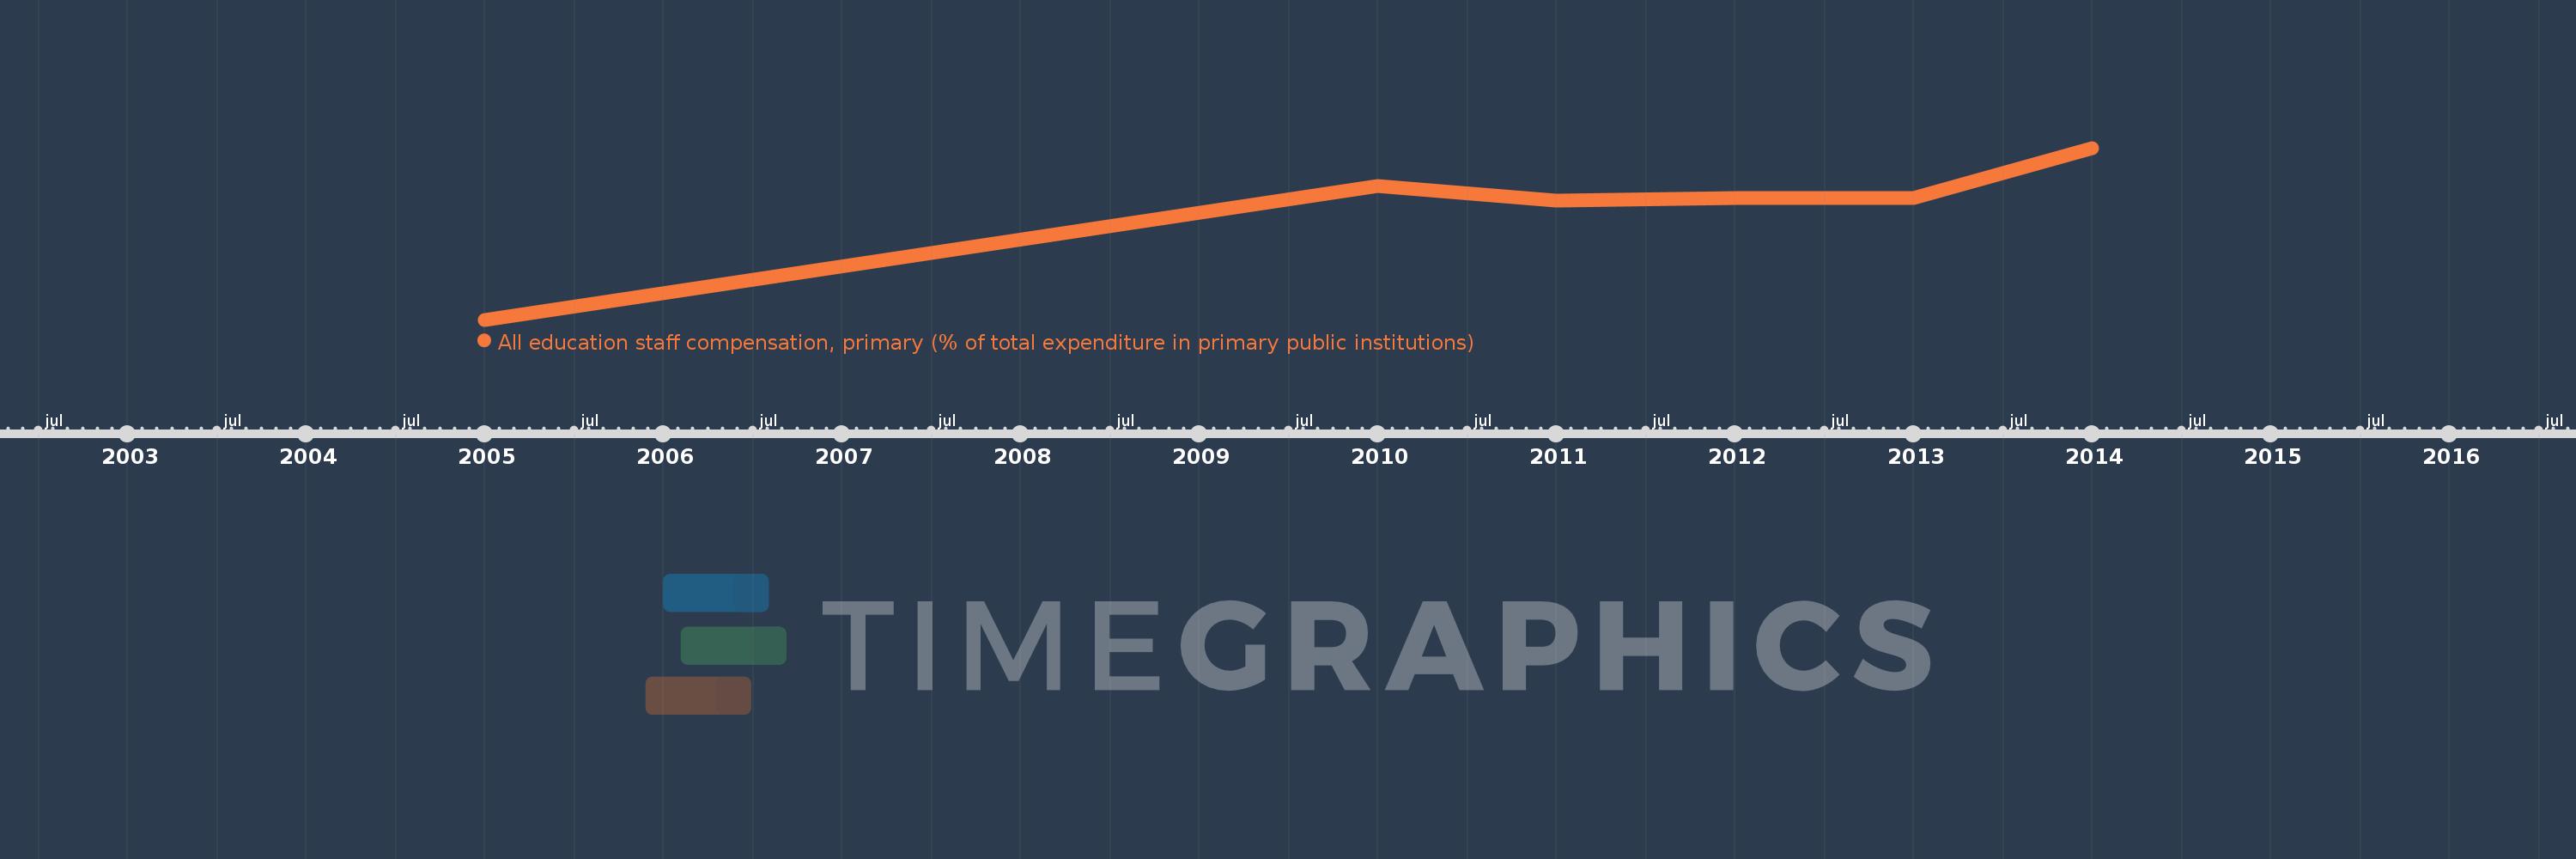
Questa scala temporale mostra un grafico dal 2005 anno al 2014 anno. Uganda. I dati fino ad 2004 anno non disponibili. Il numero di osservazioni attuali secondo i date: 6.
La fonte (nome):
Indicatori dello sviluppo mondiale
La fonte (organizzazione):
United Nations Educational, Scientific, and Cultural Organization (UNESCO) Institute for Statistics.
Categorie:
Education
sono stati aggiornati
23 apr 2017 anni
Indicatori delle variazioni dei valori per anni
In media:
75.442
Minima:
64.812
1 gen 2005 anni
Massimo:
81.196
1 gen 2014 anni
Alla data di osservazione
Valore
Variazione assoluta
La variazione rispetto al valore precedente
1 gen 2005 anni
64.812
+64.812
0.0%
1 gen 2010 anni
77.583
+12.771
19.7%
1 gen 2011 anni
76.196
-1.387
-1.79%
1 gen 2012 anni
76.433
+0.236
0.31%
1 gen 2013 anni
76.431
-0.001
0.0%
1 gen 2014 anni
81.196
+4.765
6.23%
Classificazione dei paesi secondo i statistiche attuali per anni