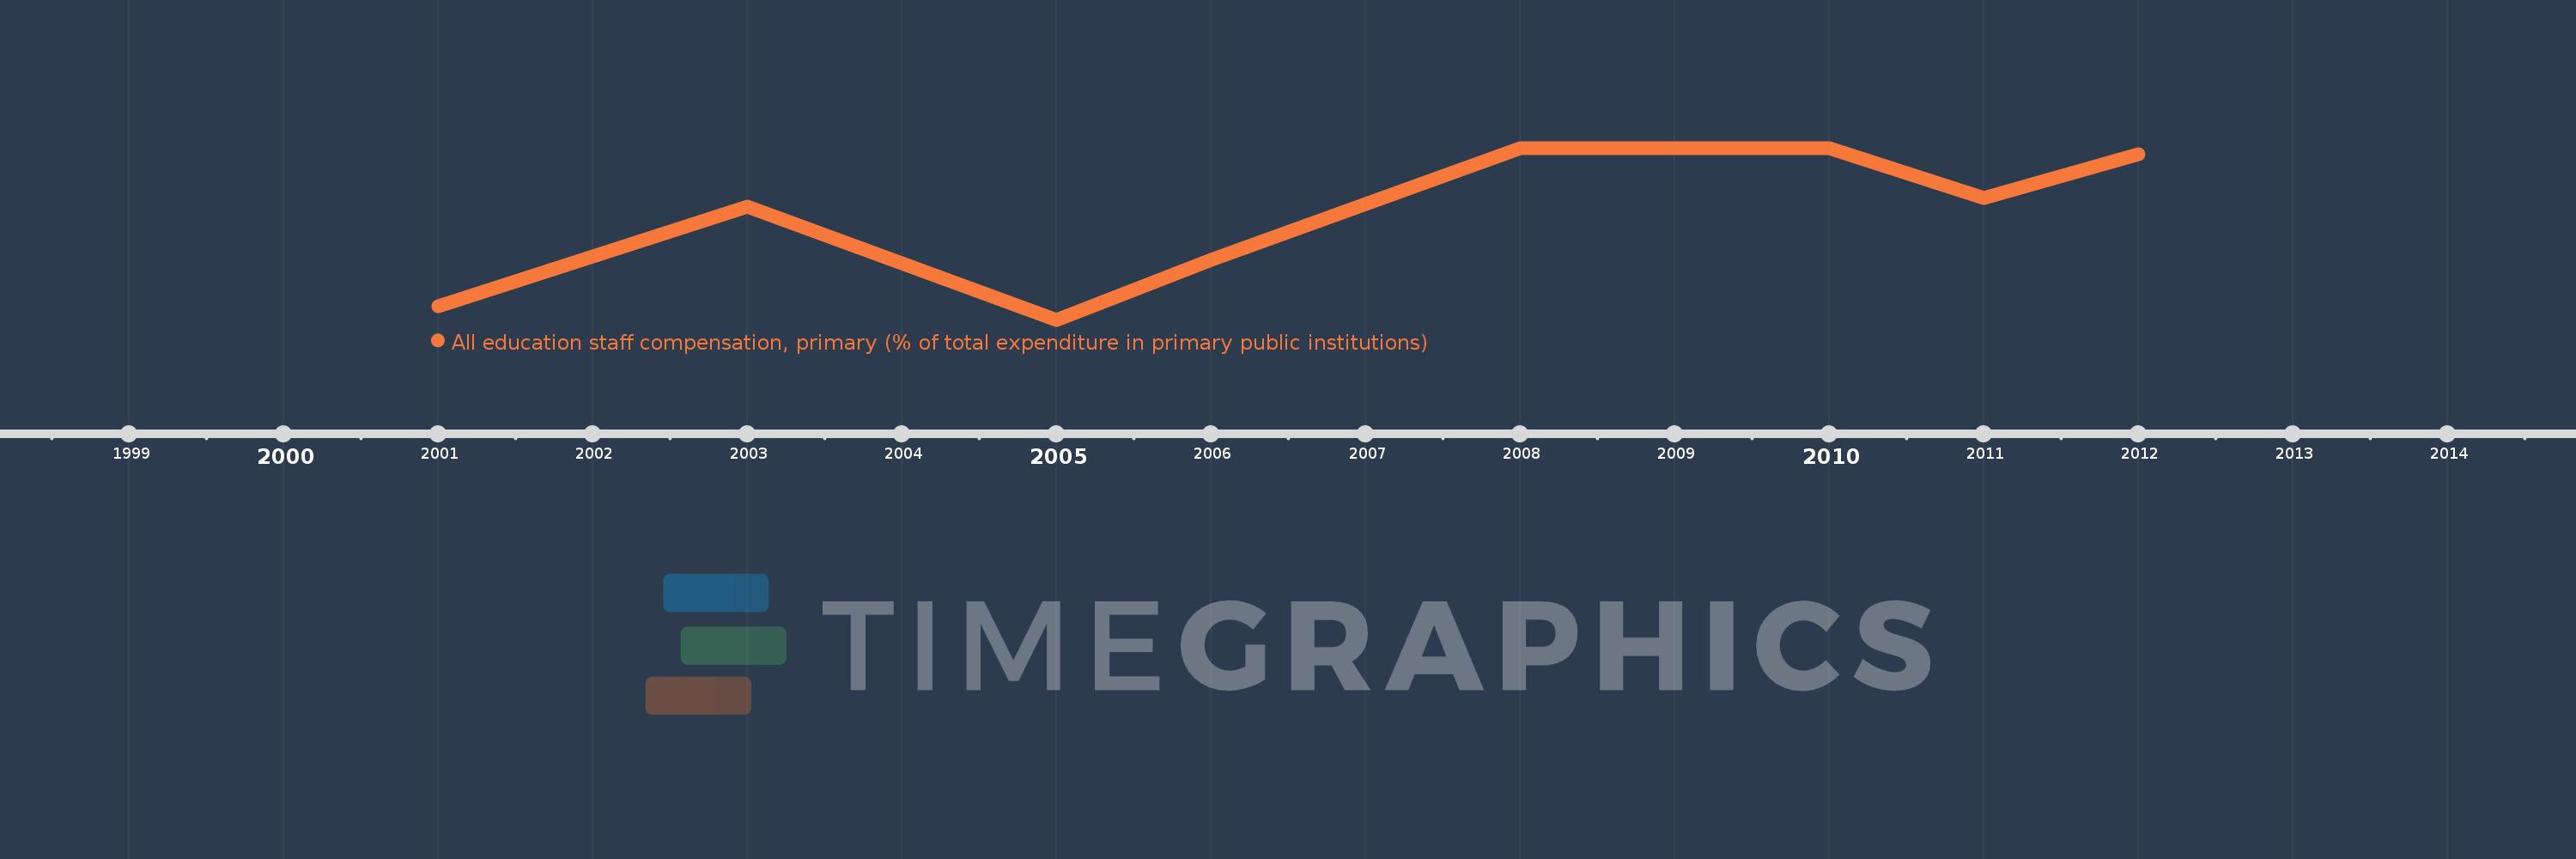
Questa scala temporale mostra un grafico dal 2001 anno al 2012 anno. St. Vincent and the Grenadines. I dati fino ad 2000 anno non disponibili. Il numero di osservazioni attuali secondo i date: 8.
La fonte (nome):
Indicatori dello sviluppo mondiale
La fonte (organizzazione):
United Nations Educational, Scientific, and Cultural Organization (UNESCO) Institute for Statistics.
Categorie:
Education
sono stati aggiornati
23 apr 2017 anni
Indicatori delle variazioni dei valori per anni
In media:
85.666
Minima:
64.663
1 gen 2005 anni
Massimo:
100.0
1 gen 2008 anni
Alla data di osservazione
Valore
Variazione assoluta
La variazione rispetto al valore precedente
1 gen 2001 anni
67.38
+67.38
0.0%
1 gen 2003 anni
87.97
+20.589
30.56%
1 gen 2005 anni
64.663
-23.306
-26.49%
1 gen 2006 anni
76.897
+12.234
18.92%
1 gen 2008 anni
100.0
+23.103
30.04%
1 gen 2010 anni
100.0
0.0
0.0%
1 gen 2011 anni
89.707
-10.293
-10.29%
1 gen 2012 anni
98.709
+9.001
10.03%
Classificazione dei paesi secondo i statistiche attuali per anni