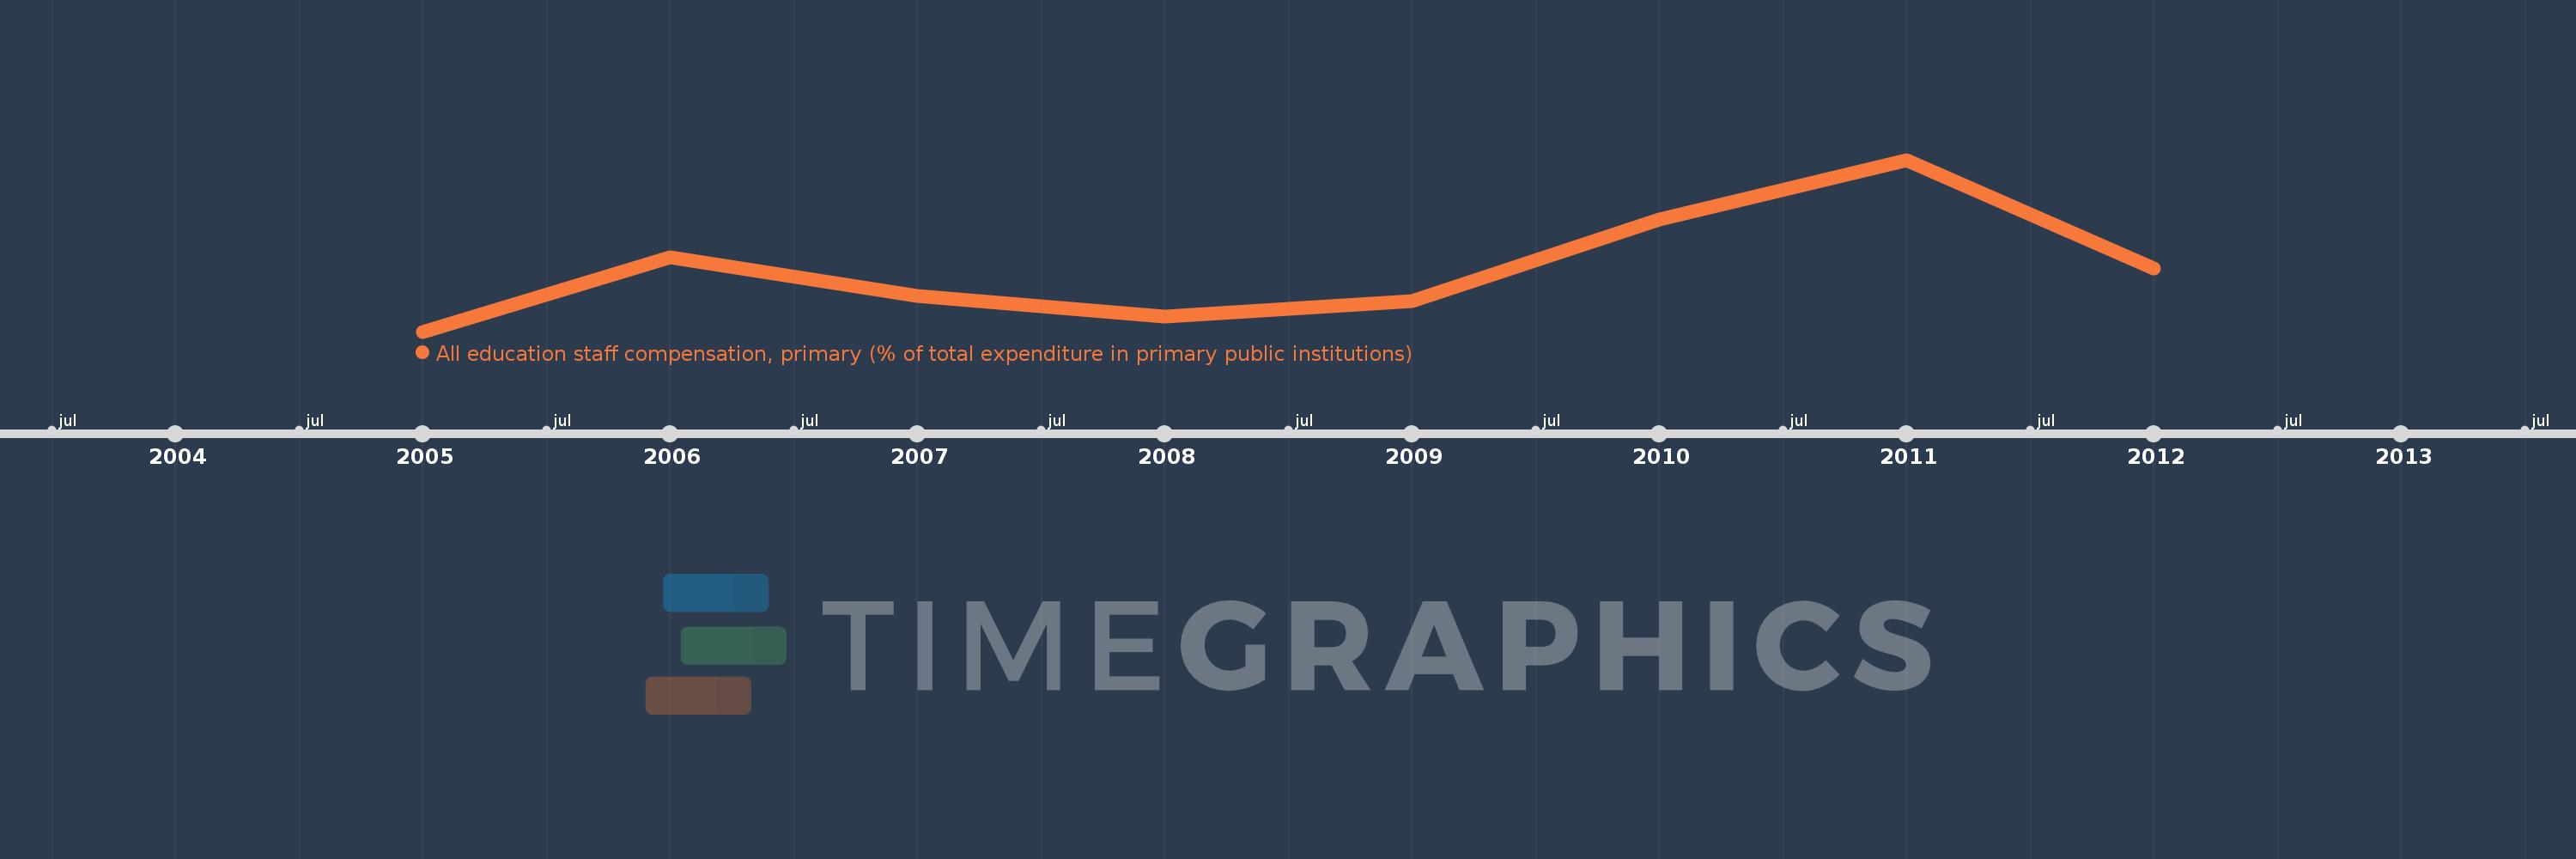
Questa scala temporale mostra un grafico dal 2005 anno al 2012 anno. Iceland. I dati fino ad 2004 anno non disponibili. Il numero di osservazioni attuali secondo i date: 8.
La fonte (nome):
Indicatori dello sviluppo mondiale
La fonte (organizzazione):
United Nations Educational, Scientific, and Cultural Organization (UNESCO) Institute for Statistics.
Categorie:
Education
sono stati aggiornati
23 apr 2017 anni
Indicatori delle variazioni dei valori per anni
In media:
69.337
Minima:
67.695
1 gen 2005 anni
Massimo:
72.197
1 gen 2011 anni
Alla data di osservazione
Valore
Variazione assoluta
La variazione rispetto al valore precedente
1 gen 2005 anni
67.695
+67.695
0.0%
1 gen 2006 anni
69.637
+1.942
2.87%
1 gen 2007 anni
68.622
-1.015
-1.46%
1 gen 2008 anni
68.085
-0.537
-0.78%
1 gen 2009 anni
68.487
+0.402
0.59%
1 gen 2010 anni
70.625
+2.138
3.12%
1 gen 2011 anni
72.197
+1.572
2.23%
1 gen 2012 anni
69.348
-2.85
-3.95%
Classificazione dei paesi secondo i statistiche attuali per anni