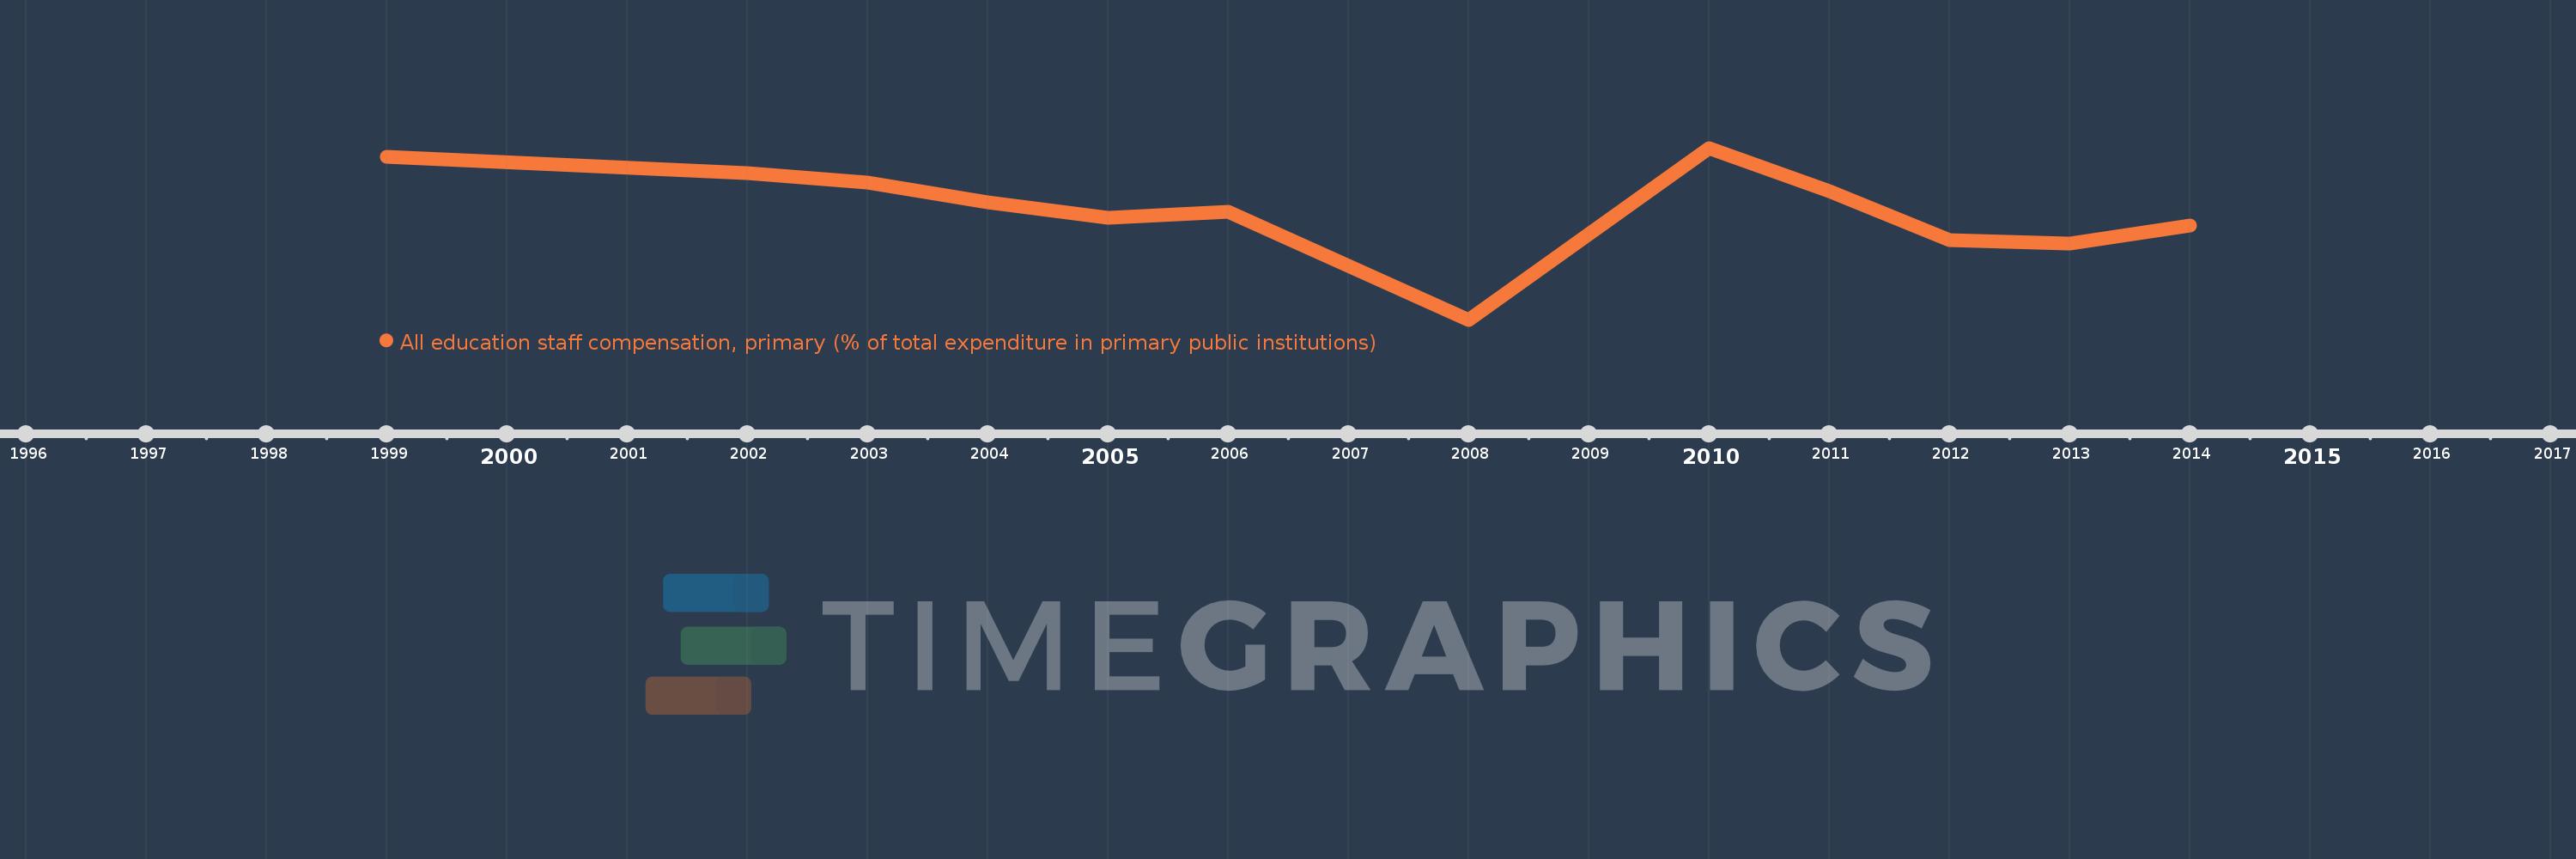
Questa scala temporale mostra un grafico dal 1999 anno al 2014 anno. Romania. I dati fino ad 1998 anno non disponibili. Il numero di osservazioni attuali secondo i date: 12.
La fonte (nome):
Indicatori dello sviluppo mondiale
La fonte (organizzazione):
United Nations Educational, Scientific, and Cultural Organization (UNESCO) Institute for Statistics.
Categorie:
Education
sono stati aggiornati
23 apr 2017 anni
Indicatori delle variazioni dei valori per anni
In media:
75.681
Minima:
63.027
1 gen 2008 anni
Massimo:
82.701
1 gen 2010 anni
Alla data di osservazione
Valore
Variazione assoluta
La variazione rispetto al valore precedente
1 gen 1999 anni
81.666
+81.666
0.0%
1 gen 2002 anni
79.859
-1.808
-2.21%
1 gen 2003 anni
78.777
-1.082
-1.35%
1 gen 2004 anni
76.498
-2.279
-2.89%
1 gen 2005 anni
74.69
-1.808
-2.36%
1 gen 2006 anni
75.429
+0.739
0.99%
1 gen 2008 anni
63.027
-12.402
-16.44%
1 gen 2010 anni
82.701
+19.674
31.22%
1 gen 2011 anni
77.728
-4.973
-6.01%
1 gen 2012 anni
72.163
-5.565
-7.16%
1 gen 2013 anni
71.782
-0.381
-0.53%
1 gen 2014 anni
73.849
+2.068
2.88%
Classificazione dei paesi secondo i statistiche attuali per anni