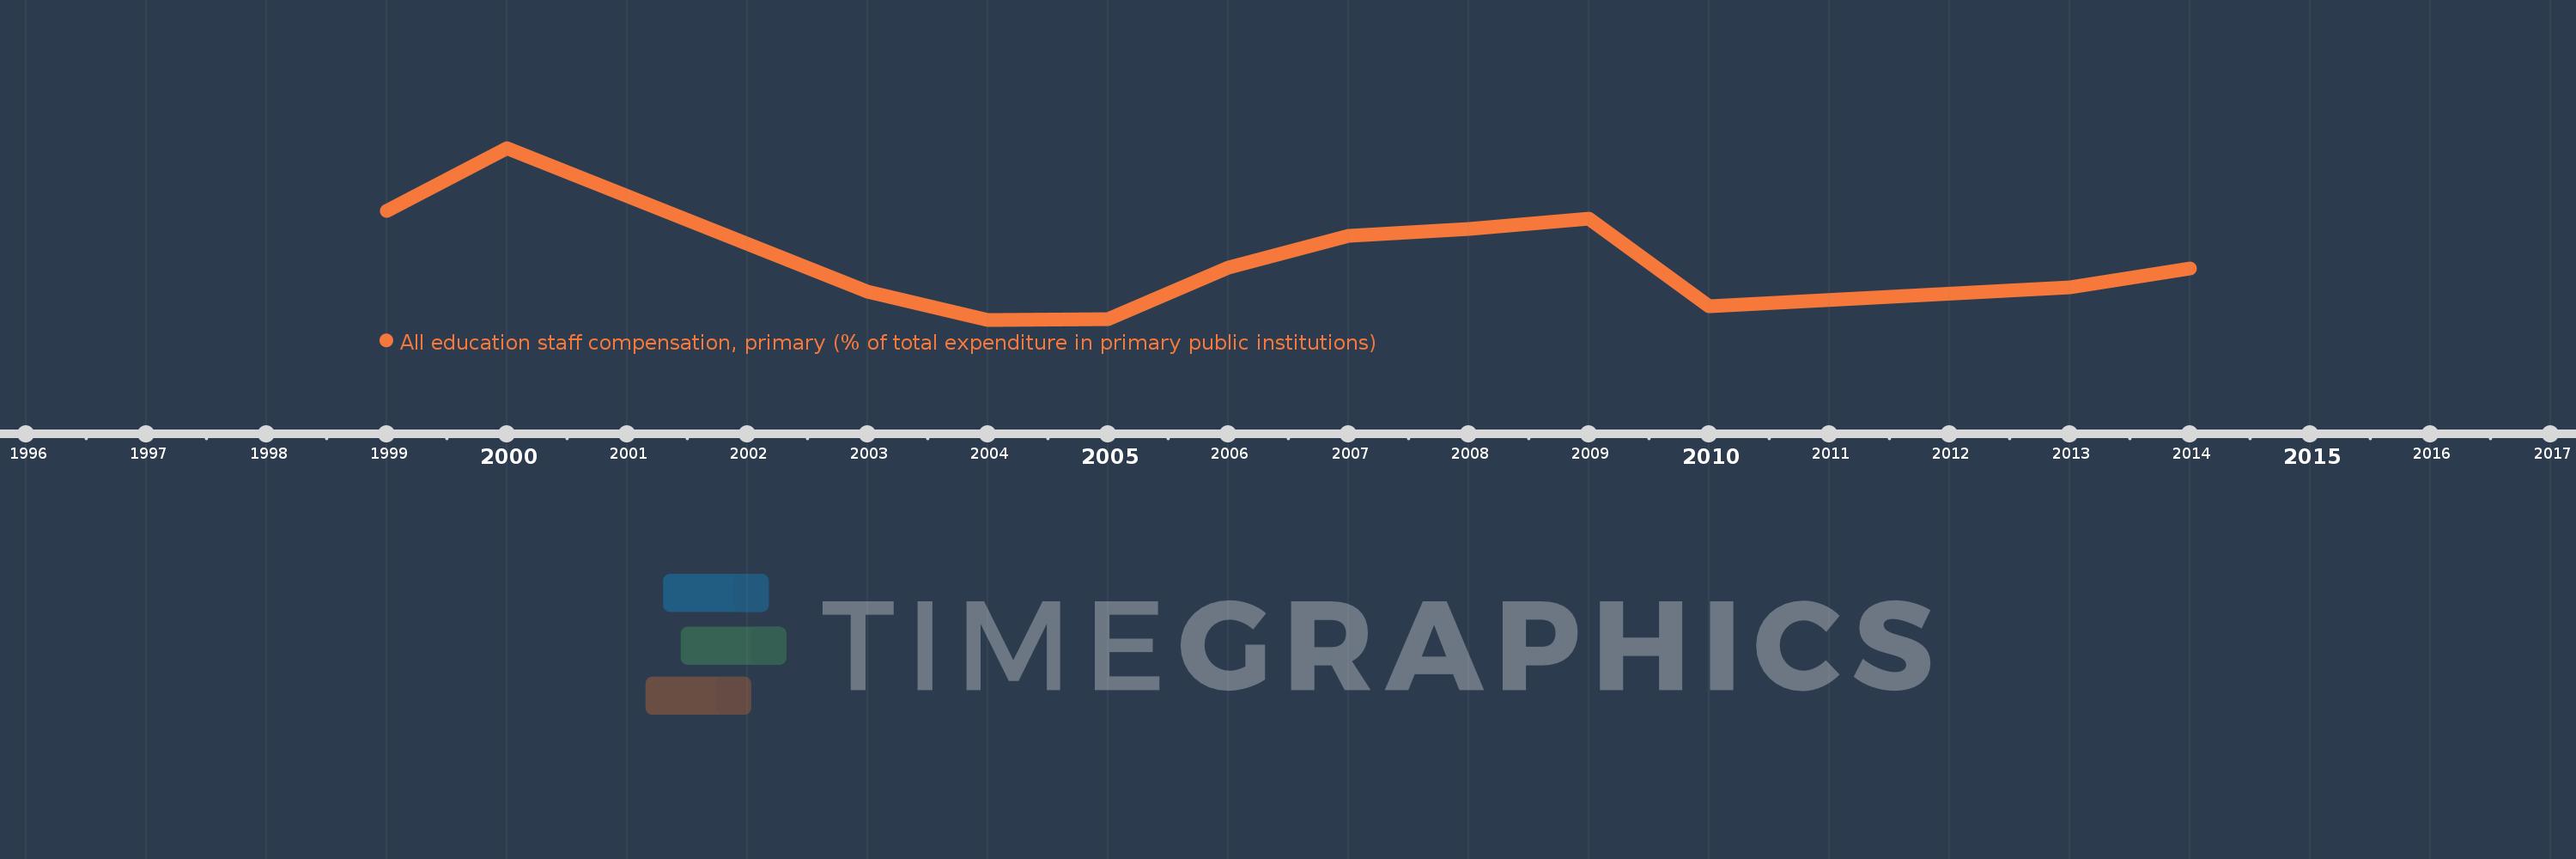
Questa scala temporale mostra un grafico dal 1999 anno al 2014 anno. Korea, Rep.. I dati fino ad 1998 anno non disponibili. Il numero di osservazioni attuali secondo i date: 12.
La fonte (nome):
Indicatori dello sviluppo mondiale
La fonte (organizzazione):
United Nations Educational, Scientific, and Cultural Organization (UNESCO) Institute for Statistics.
Categorie:
Education
sono stati aggiornati
23 apr 2017 anni
Indicatori delle variazioni dei valori per anni
In media:
63.314
Minima:
58.048
1 gen 2004 anni
Massimo:
72.816
1 gen 2000 anni
Alla data di osservazione
Valore
Variazione assoluta
La variazione rispetto al valore precedente
1 gen 1999 anni
67.411
+67.411
0.0%
1 gen 2000 anni
72.816
+5.405
8.02%
1 gen 2003 anni
60.486
-12.33
-16.93%
1 gen 2004 anni
58.048
-2.437
-4.03%
1 gen 2005 anni
58.106
+0.058
0.1%
1 gen 2006 anni
62.56
+4.453
7.66%
1 gen 2007 anni
65.289
+2.73
4.36%
1 gen 2008 anni
65.84
+0.55
0.84%
1 gen 2009 anni
66.707
+0.867
1.32%
1 gen 2010 anni
59.23
-7.477
-11.21%
1 gen 2013 anni
60.85
+1.621
2.74%
1 gen 2014 anni
62.421
+1.571
2.58%
Classificazione dei paesi secondo i statistiche attuali per anni