Questa scala temporale mostra un grafico dal 2010 anno al 2015 anno. Niger. I dati fino ad 2009 anno non disponibili. Il numero di osservazioni attuali secondo i date: 6.
La fonte (nome):
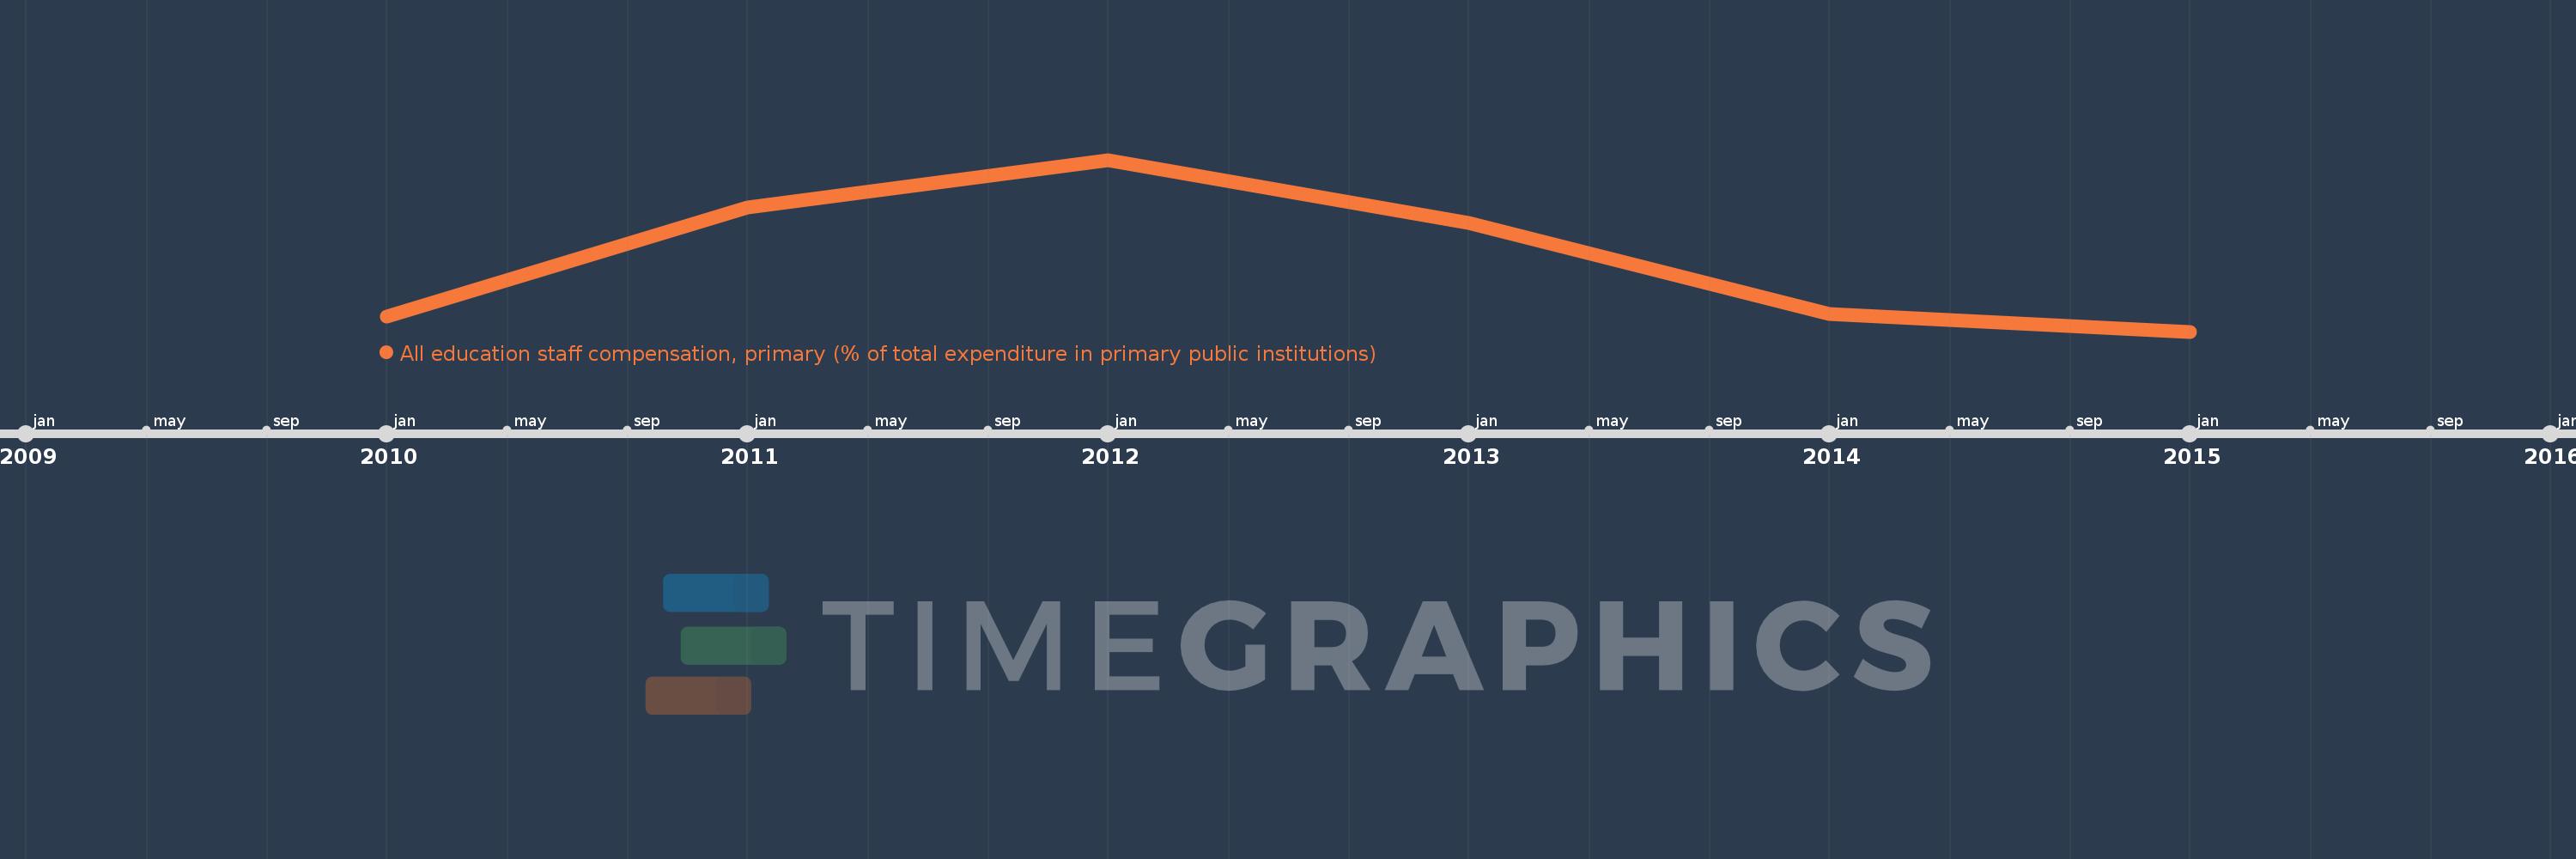
Indicatori dello sviluppo mondiale
La fonte (organizzazione):
United Nations Educational, Scientific, and Cultural Organization (UNESCO) Institute for Statistics.
Categorie:
Education
sono stati aggiornati
23 apr 2017 anni
Indicatori delle variazioni dei valori per anni
In media:
76.702
Minima:
68.565
1 gen 2015 anni
Massimo:
87.734
1 gen 2012 anni
Alla data di osservazione
Valore
Variazione assoluta
La variazione rispetto al valore precedente
1 gen 2010 anni
70.264
+70.264
0.0%
1 gen 2011 anni
82.432
+12.168
17.32%
1 gen 2012 anni
87.734
+5.302
6.43%
1 gen 2013 anni
80.717
-7.017
-8.0%
1 gen 2014 anni
70.501
-10.216
-12.66%
1 gen 2015 anni
68.565
-1.936
-2.75%
Classificazione dei paesi secondo i statistiche attuali per anni