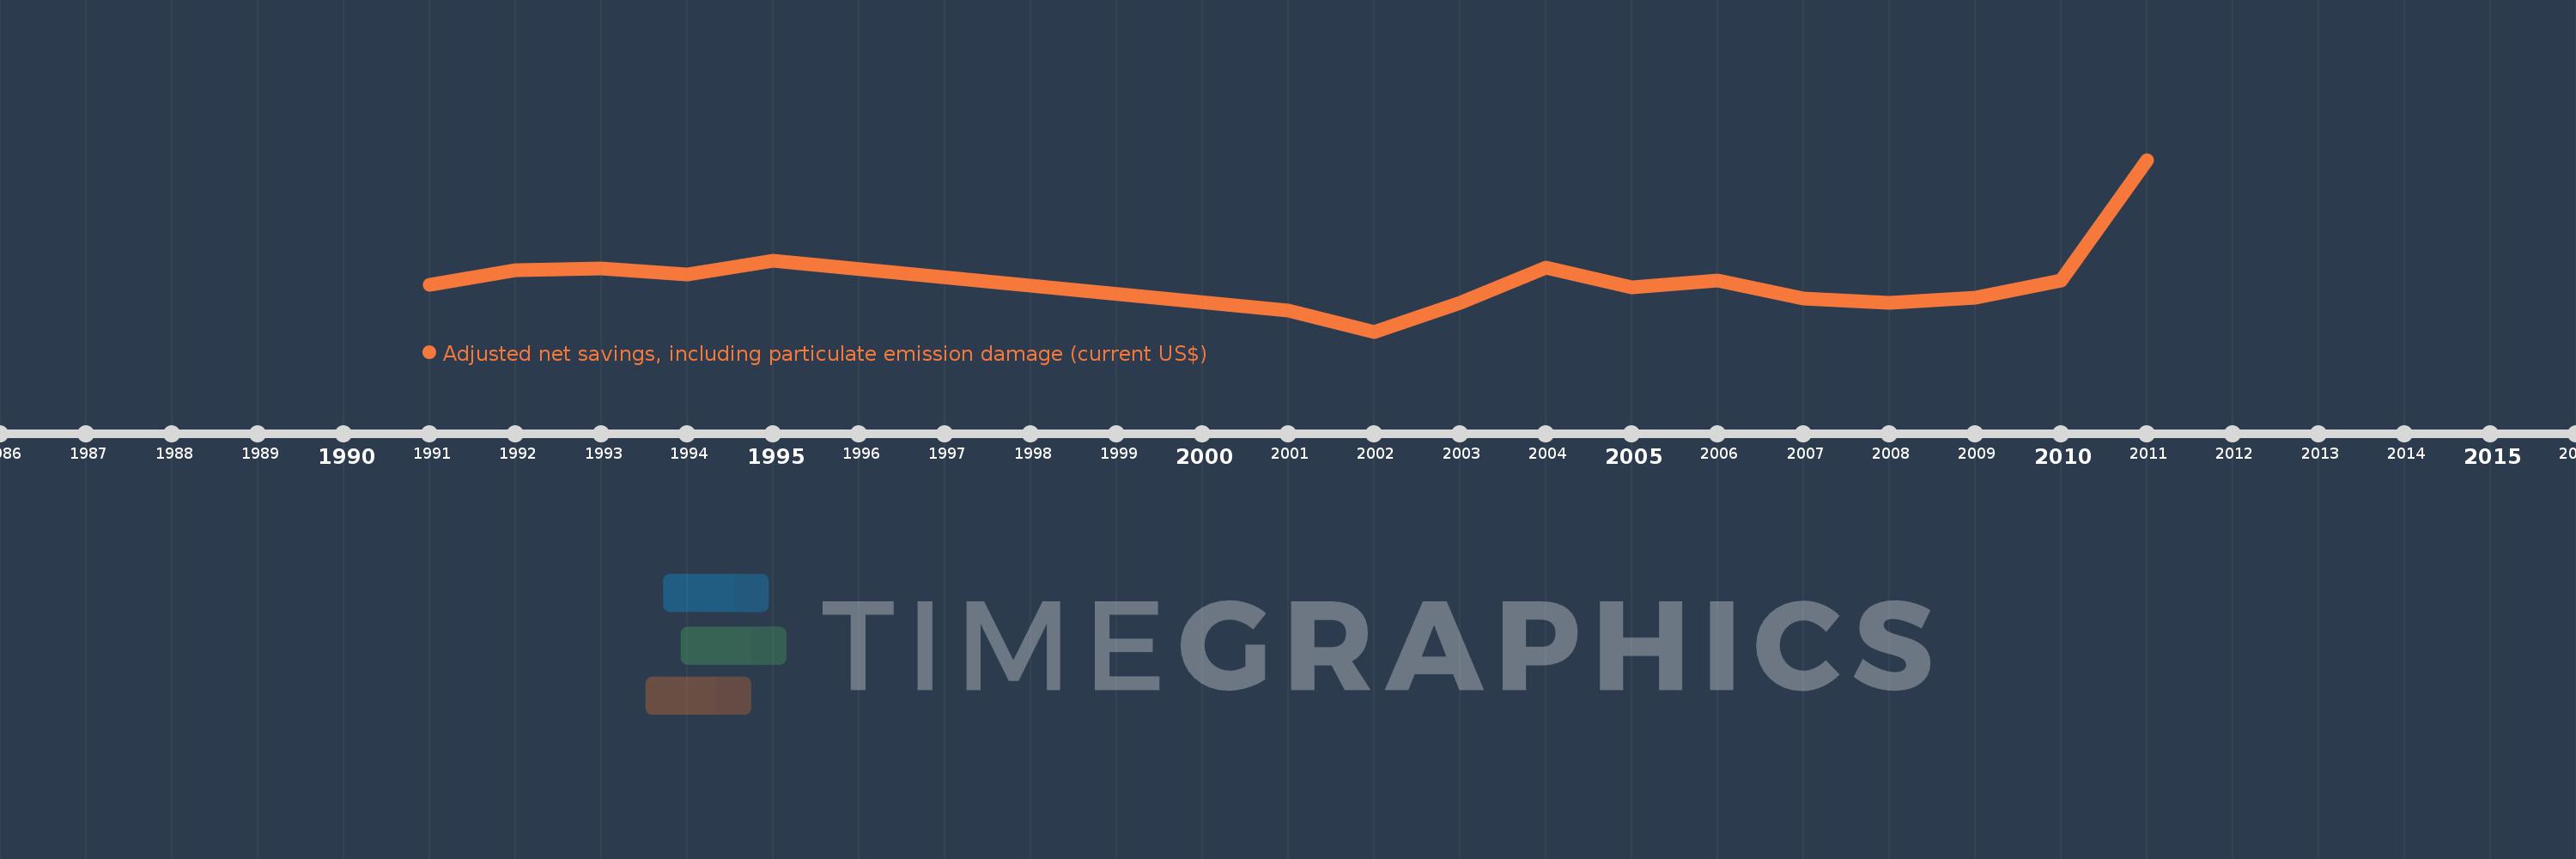
Questa scala temporale mostra un grafico dal 1991 anno al 2011 anno. Burkina Faso. I dati fino ad 1990 anno non disponibili. Il numero di osservazioni attuali secondo i date: 16.
La fonte (nome):
Indicatori dello sviluppo mondiale
La fonte (organizzazione):
World Bank staff estimates based on sources and methods in World Bank's "The Changing Wealth of Nations: Measuring Sustainable Development in the New Millennium" (2011).
Categorie:
Economy & Growth, Environment
sono stati aggiornati
23 apr 2017 anni
Indicatori delle variazioni dei valori per anni
In media:
219.533 Mln
Minima:
-78.988 Mln
1 gen 2002 anni
Massimo:
912.563 Mln
1 gen 2011 anni
Alla data di osservazione
Valore
Variazione assoluta
La variazione rispetto al valore precedente
1 gen 1991 anni
192.217 Mln
+192.217 Mln
0.0%
1 gen 1992 anni
275.674 Mln
+83.457 Mln
43.42%
1 gen 1993 anni
285.925 Mln
+10.251 Mln
3.72%
1 gen 1994 anni
248.266 Mln
-37.658 Mln
-13.17%
1 gen 1995 anni
329.041 Mln
+80.775 Mln
32.54%
1 gen 2001 anni
43.122 Mln
-285.919 Mln
-86.89%
1 gen 2002 anni
-78.988 Mln
-122.11 Mln
-283.17%
1 gen 2003 anni
87.432 Mln
+166.42 Mln
-210.69%
1 gen 2004 anni
291.475 Mln
+204.043 Mln
233.37%
1 gen 2005 anni
174.757 Mln
-116.719 Mln
-40.04%
1 gen 2006 anni
214.713 Mln
+39.956 Mln
22.86%
1 gen 2007 anni
113.944 Mln
-100.769 Mln
-46.93%
1 gen 2008 anni
88.022 Mln
-25.922 Mln
-22.75%
1 gen 2009 anni
117.41 Mln
+29.387 Mln
33.39%
1 gen 2010 anni
216.954 Mln
+99.545 Mln
84.78%
1 gen 2011 anni
912.563 Mln
+695.608 Mln
320.62%
Classificazione dei paesi secondo i statistiche attuali per anni