Questa scala temporale mostra un grafico dal 2005 anno al 2015 anno. Liberia. I dati fino ad 2004 anno non disponibili. Il numero di osservazioni attuali secondo i date: 11.
La fonte (nome):
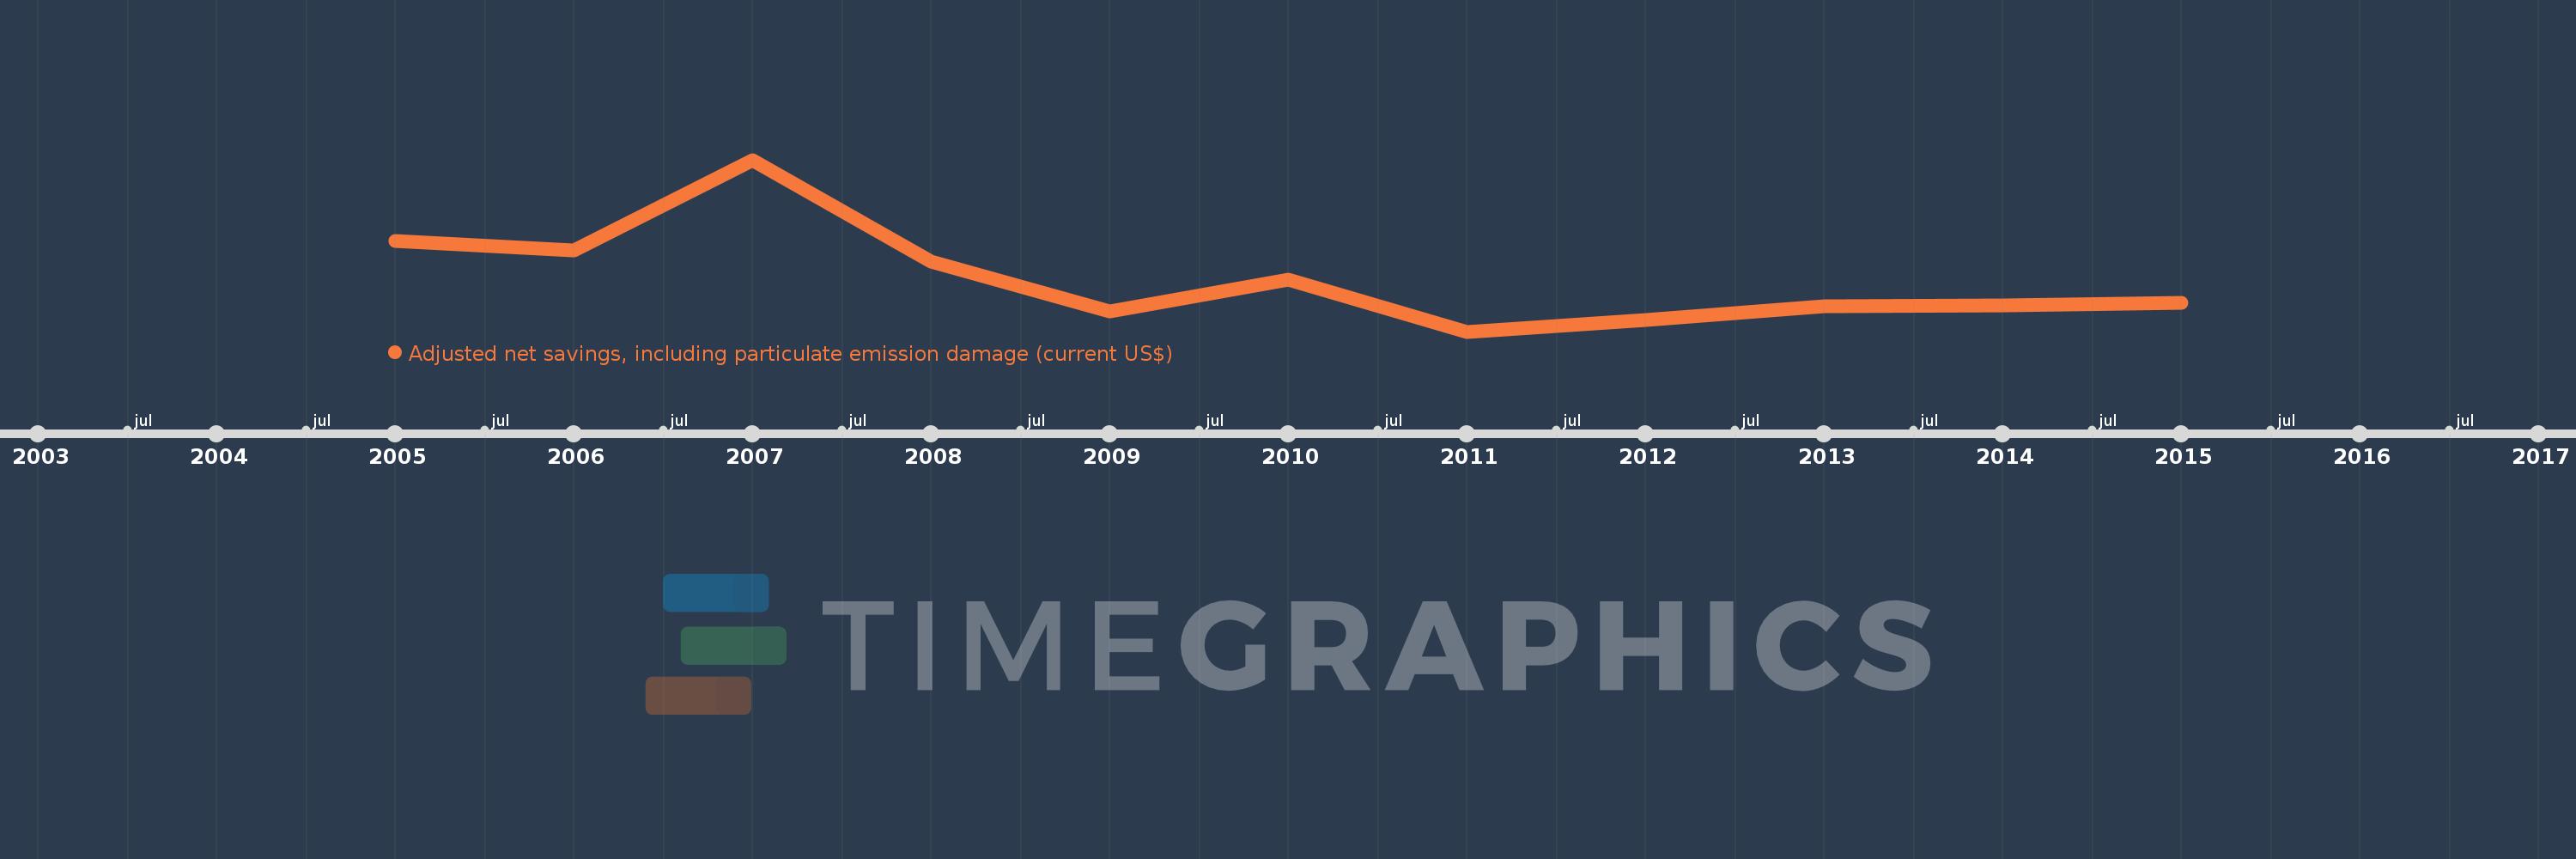
Indicatori dello sviluppo mondiale
La fonte (organizzazione):
World Bank staff estimates based on sources and methods in World Bank's "The Changing Wealth of Nations: Measuring Sustainable Development in the New Millennium" (2011).
Categorie:
Economy & Growth, Environment
sono stati aggiornati
23 apr 2017 anni
Indicatori delle variazioni dei valori per anni
In media:
-323.733 Mln
Minima:
-645.32 Mln
1 gen 2011 anni
Massimo:
409.308 Mln
1 gen 2007 anni
Alla data di osservazione
Valore
Variazione assoluta
La variazione rispetto al valore precedente
1 gen 2005 anni
-91.112 Mln
-91.112 Mln
0.0%
1 gen 2006 anni
-149.07 Mln
-57.958 Mln
63.61%
1 gen 2007 anni
409.308 Mln
+558.377 Mln
-374.57%
1 gen 2008 anni
-214.35 Mln
-623.658 Mln
-152.37%
1 gen 2009 anni
-522.266 Mln
-307.916 Mln
143.65%
1 gen 2010 anni
-328.6 Mln
+193.666 Mln
-37.08%
1 gen 2011 anni
-645.32 Mln
-316.72 Mln
96.38%
1 gen 2012 anni
-574.833 Mln
+70.487 Mln
-10.92%
1 gen 2013 anni
-490.465 Mln
+84.368 Mln
-14.68%
1 gen 2014 anni
-486.079 Mln
+4.386 Mln
-0.89%
1 gen 2015 anni
-468.277 Mln
+17.802 Mln
-3.66%
Classificazione dei paesi secondo i statistiche attuali per anni