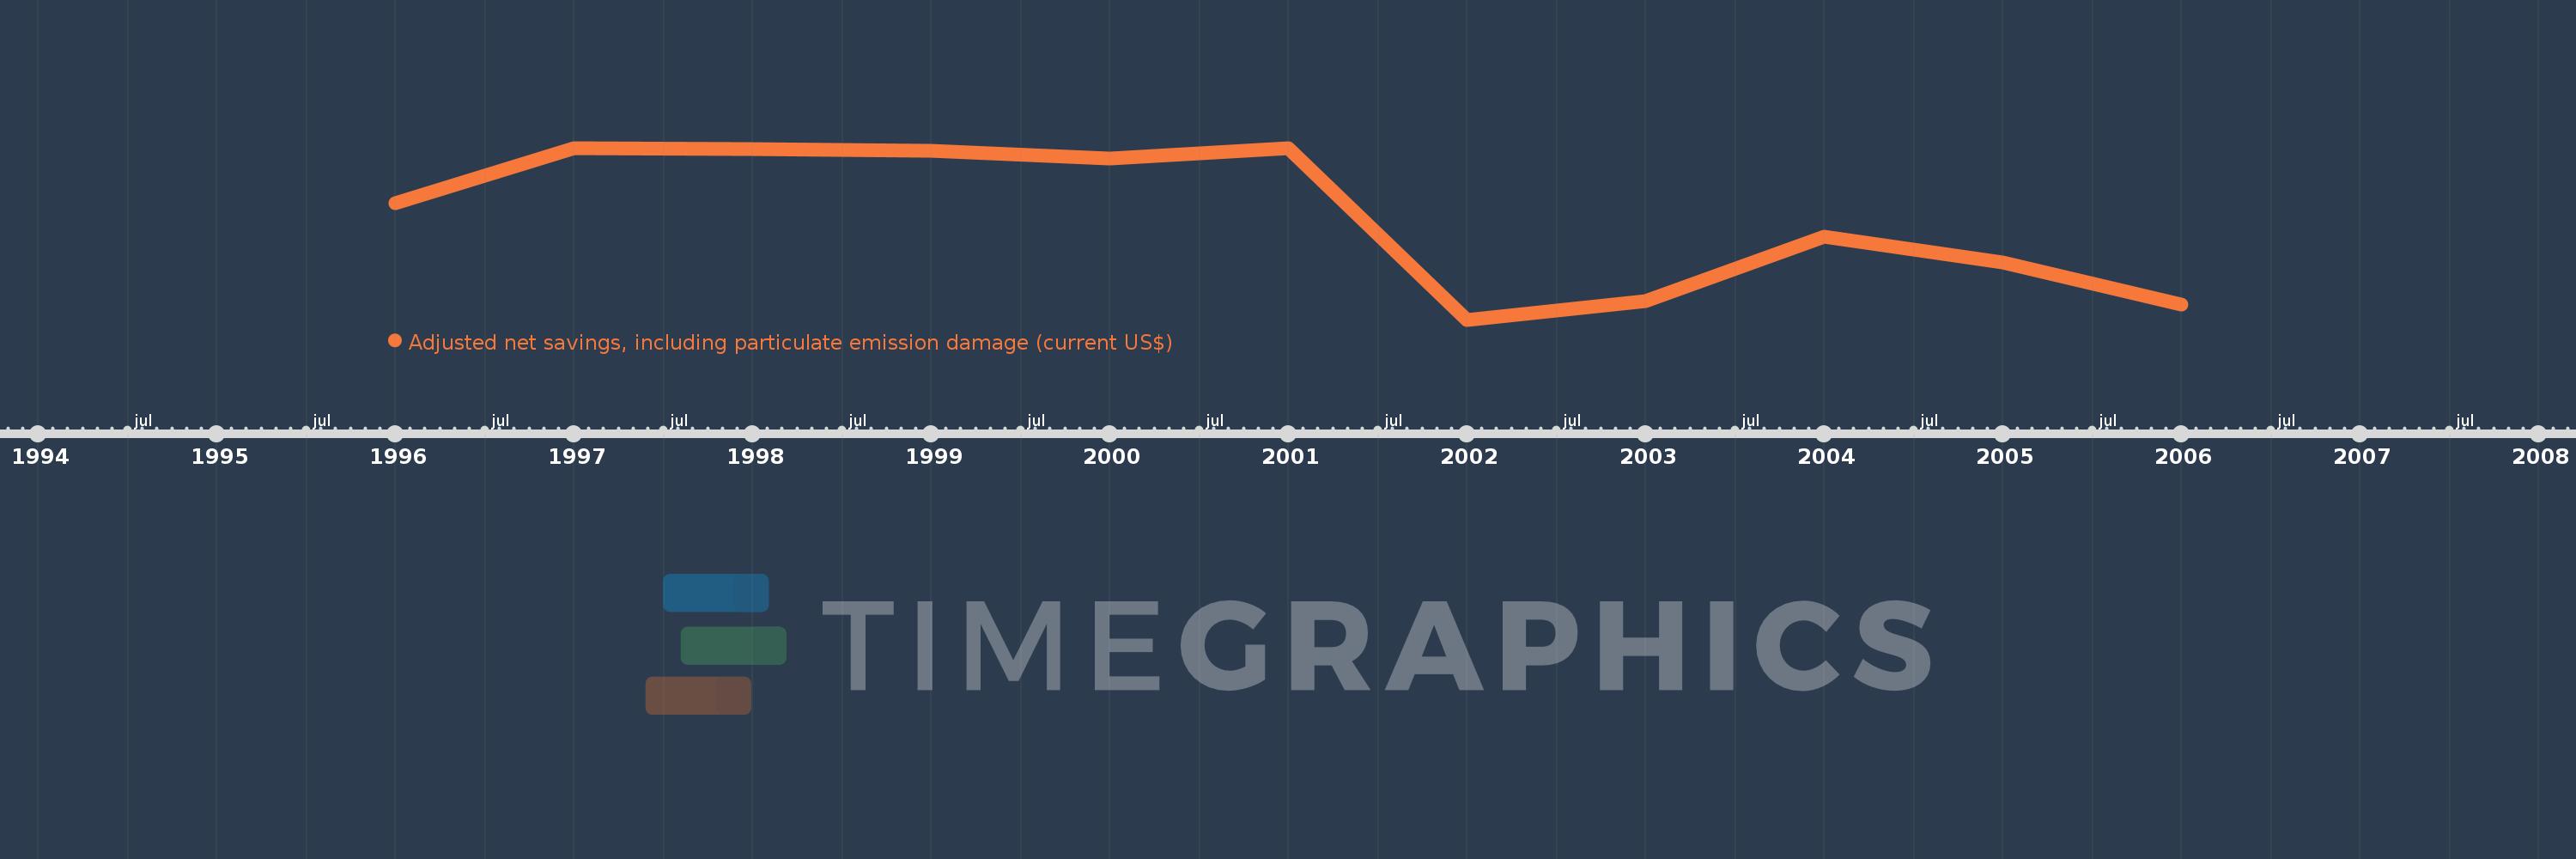
Questa scala temporale mostra un grafico dal 1996 anno al 2006 anno. Maldives. I dati fino ad 1995 anno non disponibili. Il numero di osservazioni attuali secondo i date: 11.
La fonte (nome):
Indicatori dello sviluppo mondiale
La fonte (organizzazione):
World Bank staff estimates based on sources and methods in World Bank's "The Changing Wealth of Nations: Measuring Sustainable Development in the New Millennium" (2011).
Categorie:
Economy & Growth, Environment
sono stati aggiornati
23 apr 2017 anni
Indicatori delle variazioni dei valori per anni
In media:
150.754 Mln
Minima:
82.943 Mln
1 gen 2002 anni
Massimo:
195.801 Mln
1 gen 2001 anni
Alla data di osservazione
Valore
Variazione assoluta
La variazione rispetto al valore precedente
1 gen 1996 anni
159.644 Mln
+159.644 Mln
0.0%
1 gen 1997 anni
195.394 Mln
+35.75 Mln
22.39%
1 gen 1998 anni
195.239 Mln
-155.555 Mille.
-0.08%
1 gen 1999 anni
193.922 Mln
-1.317 Mln
-0.67%
1 gen 2000 anni
188.701 Mln
-5.221 Mln
-2.69%
1 gen 2001 anni
195.801 Mln
+7.1 Mln
3.76%
1 gen 2002 anni
82.943 Mln
-112.858 Mln
-57.64%
1 gen 2003 anni
95.157 Mln
+12.214 Mln
14.73%
1 gen 2004 anni
137.665 Mln
+42.508 Mln
44.67%
1 gen 2005 anni
120.632 Mln
-17.033 Mln
-12.37%
1 gen 2006 anni
93.196 Mln
-27.436 Mln
-22.74%
Classificazione dei paesi secondo i statistiche attuali per anni