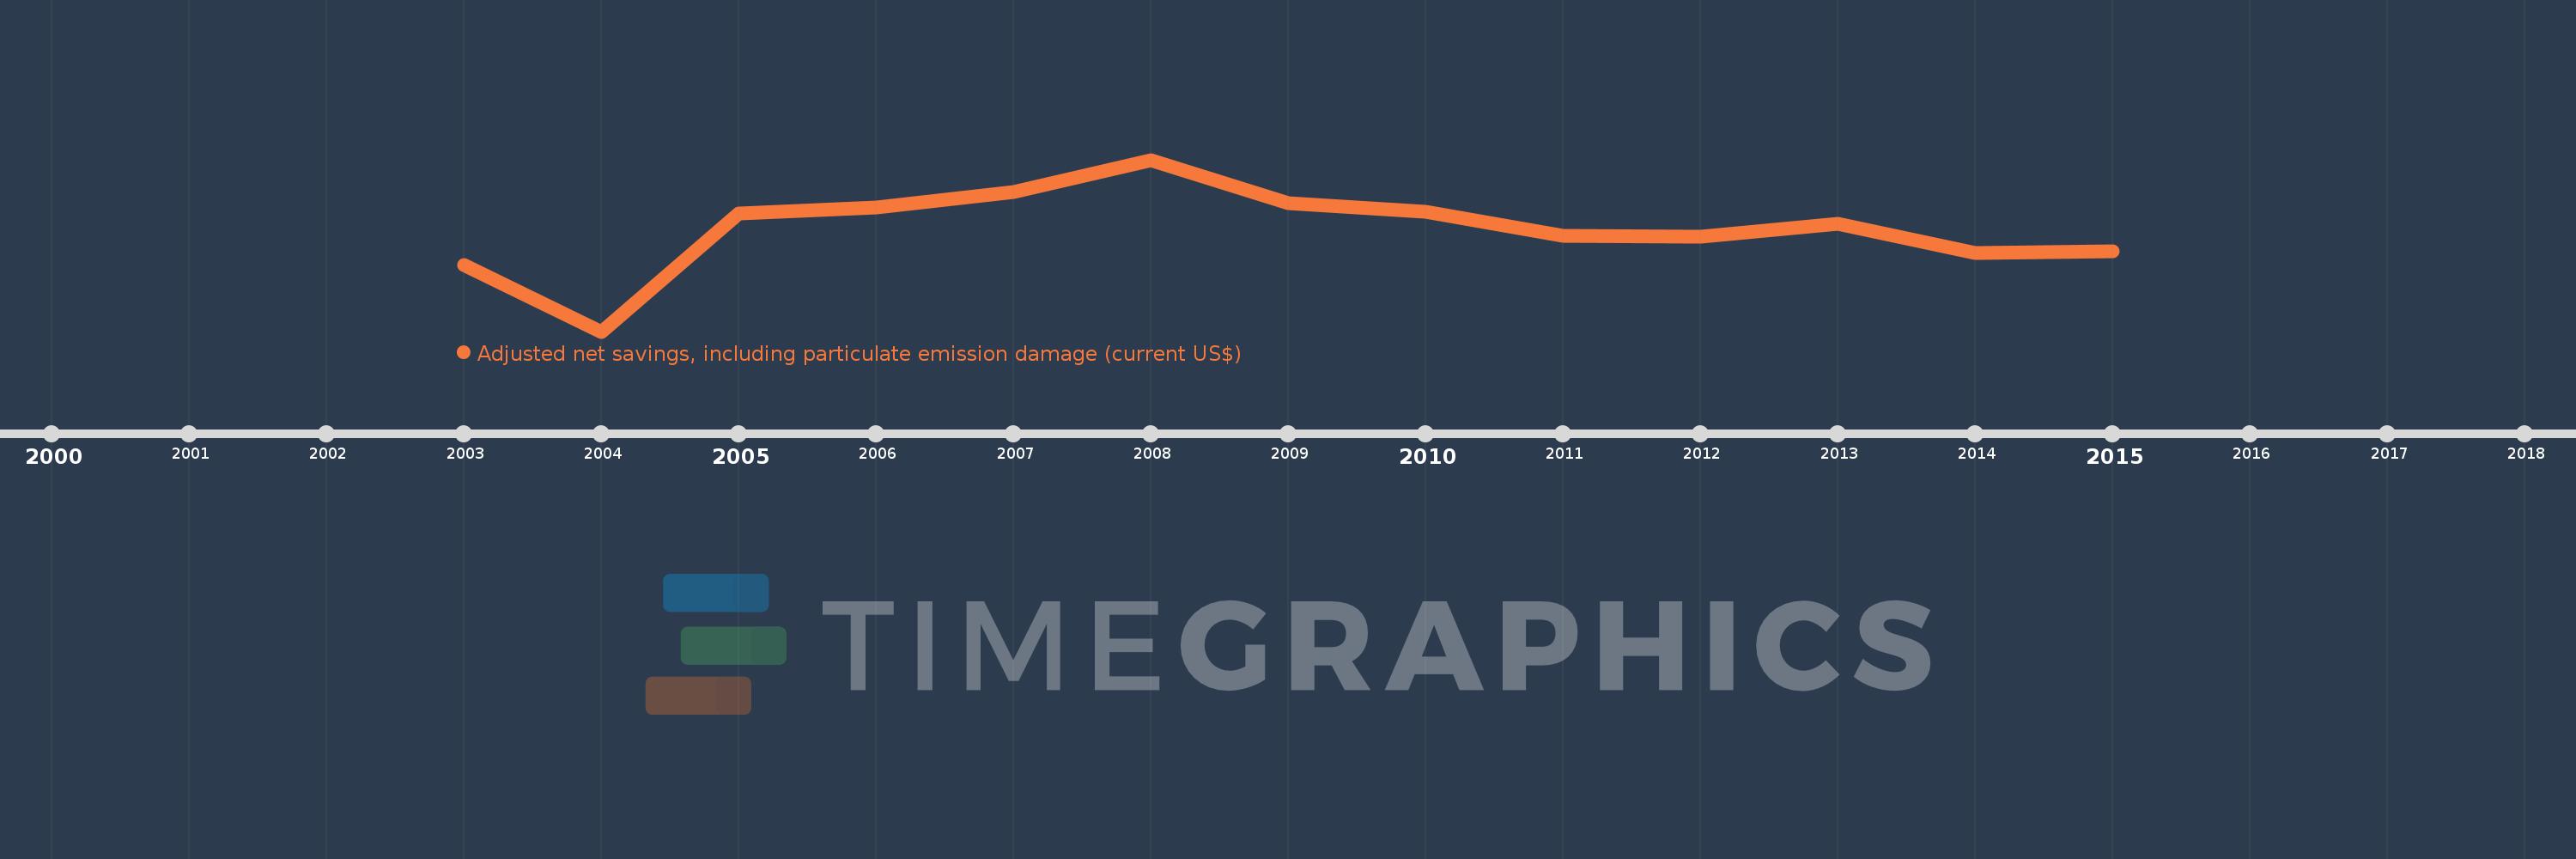
Questa scala temporale mostra un grafico dal 2003 anno al 2015 anno. Lebanon. I dati fino ad 2002 anno non disponibili. Il numero di osservazioni attuali secondo i date: 13.
La fonte (nome):
Indicatori dello sviluppo mondiale
La fonte (organizzazione):
World Bank staff estimates based on sources and methods in World Bank's "The Changing Wealth of Nations: Measuring Sustainable Development in the New Millennium" (2011).
Categorie:
Economy & Growth, Environment
sono stati aggiornati
23 apr 2017 anni
Indicatori delle variazioni dei valori per anni
In media:
-2.658 Mlrd
Minima:
-6.701 Mlrd
1 gen 2004 anni
Massimo:
110.892 Mln
1 gen 2008 anni
Alla data di osservazione
Valore
Variazione assoluta
La variazione rispetto al valore precedente
1 gen 2003 anni
-4.055 Mlrd
-4.055 Mlrd
0.0%
1 gen 2004 anni
-6.701 Mlrd
-2.646 Mlrd
65.25%
1 gen 2005 anni
-2.017 Mlrd
+4.685 Mlrd
-69.91%
1 gen 2006 anni
-1.796 Mlrd
+220.76 Mln
-10.95%
1 gen 2007 anni
-1.17 Mlrd
+625.923 Mln
-34.85%
1 gen 2008 anni
110.892 Mln
+1.281 Mlrd
-109.48%
1 gen 2009 anni
-1.608 Mlrd
-1.718 Mlrd
-1.55 Mille.%
1 gen 2010 anni
-1.947 Mlrd
-339.511 Mln
21.12%
1 gen 2011 anni
-2.9 Mlrd
-952.749 Mln
48.93%
1 gen 2012 anni
-2.948 Mlrd
-47.803 Mln
1.65%
1 gen 2013 anni
-2.424 Mlrd
+523.618 Mln
-17.76%
1 gen 2014 anni
-3.581 Mlrd
-1.157 Mlrd
47.72%
1 gen 2015 anni
-3.525 Mlrd
+56.102 Mln
-1.57%
Classificazione dei paesi secondo i statistiche attuali per anni