Download Queste statistiche in altri paesi:
AfghanistanAlbaniaAlgeriaAngolaArgentinaArmeniaAustraliaAustriaAzerbaijanBahamas, TheBahrainBangladeshBarbadosBelarusBelgiumBelizeBeninBhutanBoliviaBotswanaBrazilBrunei DarussalamBulgariaBurkina FasoBurundiCabo VerdeCambodiaCameroonCanadaCentral African RepublicChadChileChinaColombiaComorosCongo, Dem. Rep.Congo, Rep.Costa RicaCote d'IvoireCroatiaCyprusCzech RepublicDenmarkDominican RepublicEcuadorEgypt, Arab Rep.El SalvadorEquatorial GuineaEritreaEstoniaEthiopiaFijiFinlandFranceGabonGambia, TheGeorgiaGermanyGhanaGreeceGuatemalaGuineaGuinea-BissauGuyanaHaitiHondurasHungaryIcelandIndiaIndonesiaIran, Islamic Rep.IraqIrelandIsraelItalyJamaicaJapanJordanKazakhstanKenyaKorea, Rep.KuwaitKyrgyz RepublicLao PDRLatviaLebanonLesothoLiberiaLibyaLithuaniaLuxembourgMacedonia, FYRMadagascarMalawiMalaysiaMaldivesMaliMauritaniaMauritiusMexicoMoldovaMongoliaMoroccoMozambiqueNamibiaNepalNetherlandsNew ZealandNicaraguaNigerNigeriaNorwayOmanPakistanPanamaPapua New GuineaParaguayPeruPhilippinesPolandPortugalQatarRomaniaRussian FederationRwandaSaudi ArabiaSenegalSierra LeoneSingaporeSlovak RepublicSloveniaSolomon IslandsSouth AfricaSpainSri LankaSudanSurinameSwazilandSwedenSwitzerlandSyrian Arab RepublicTajikistanTanzaniaThailandTogoTrinidad and TobagoTunisiaTurkeyUgandaUkraineUnited KingdomUnited StatesUruguayVenezuela, RBVietnamYemen, Rep.ZambiaZimbabwe Linea del tempo:
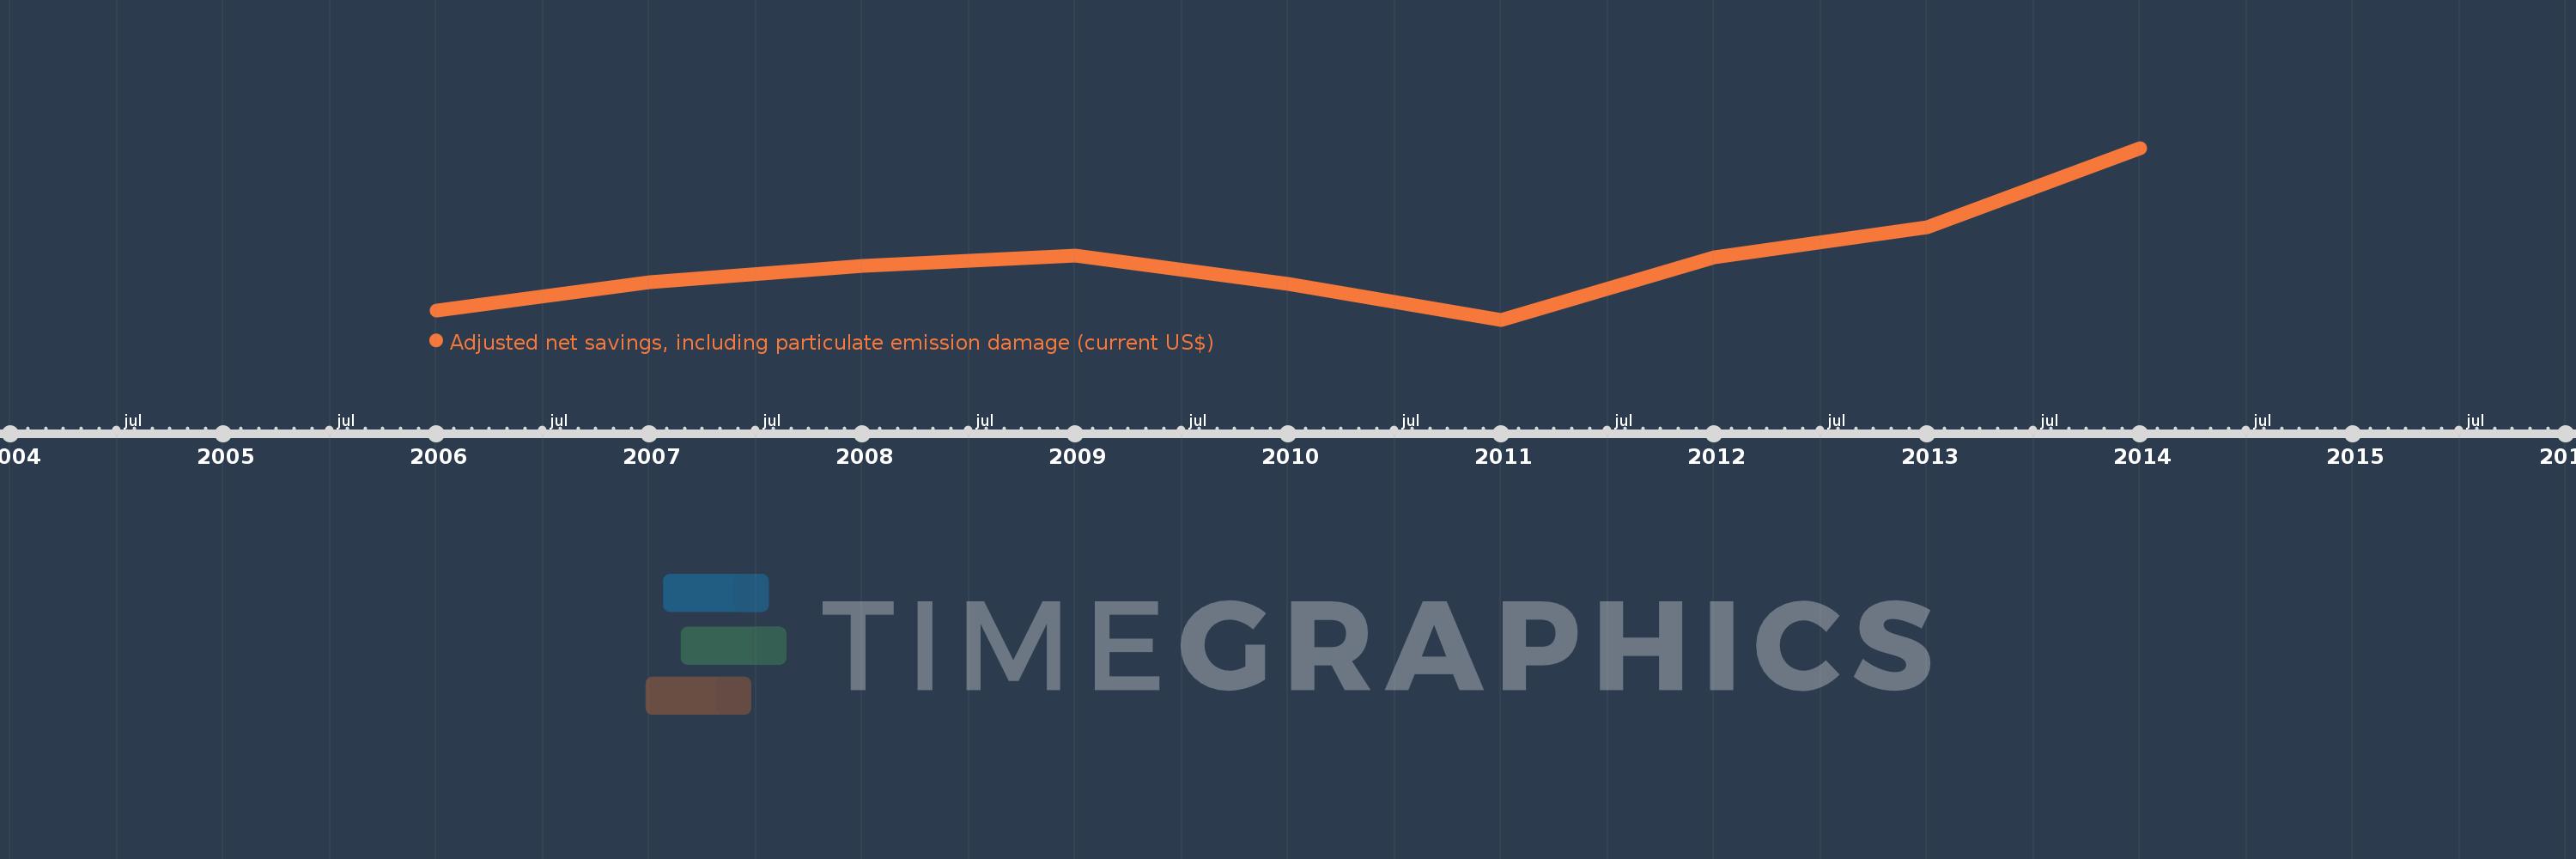
Questa scala temporale mostra un grafico dal 2006 anno al 2014 anno. Lesotho. I dati fino ad 2005 anno non disponibili. Il numero di osservazioni attuali secondo i date: 9.
La fonte (nome):
Indicatori dello sviluppo mondiale
La fonte (organizzazione):
World Bank staff estimates based on sources and methods in World Bank's "The Changing Wealth of Nations: Measuring Sustainable Development in the New Millennium" (2011).
Categorie:
Economy & Growth, Environment
sono stati aggiornati
23 apr 2017 anni
Indicatori delle variazioni dei valori per anni
Minima:
228.502 Mln
1 gen 2011 anni
Massimo:
836.069 Mln
1 gen 2014 anni
Alla data di osservazione
Valore
Variazione assoluta
La variazione rispetto al valore precedente
1 gen 2006 anni
259.732 Mln
+259.732 Mln
0.0%
1 gen 2007 anni
360.42 Mln
+100.687 Mln
38.77%
1 gen 2008 anni
418.958 Mln
+58.539 Mln
16.24%
1 gen 2009 anni
454.283 Mln
+35.325 Mln
8.43%
1 gen 2010 anni
356.185 Mln
-98.098 Mln
-21.59%
1 gen 2011 anni
228.502 Mln
-127.683 Mln
-35.85%
1 gen 2012 anni
450.769 Mln
+222.267 Mln
97.27%
1 gen 2013 anni
554.895 Mln
+104.126 Mln
23.1%
1 gen 2014 anni
836.069 Mln
+281.174 Mln
50.67%
Classificazione dei paesi secondo i statistiche attuali per anni