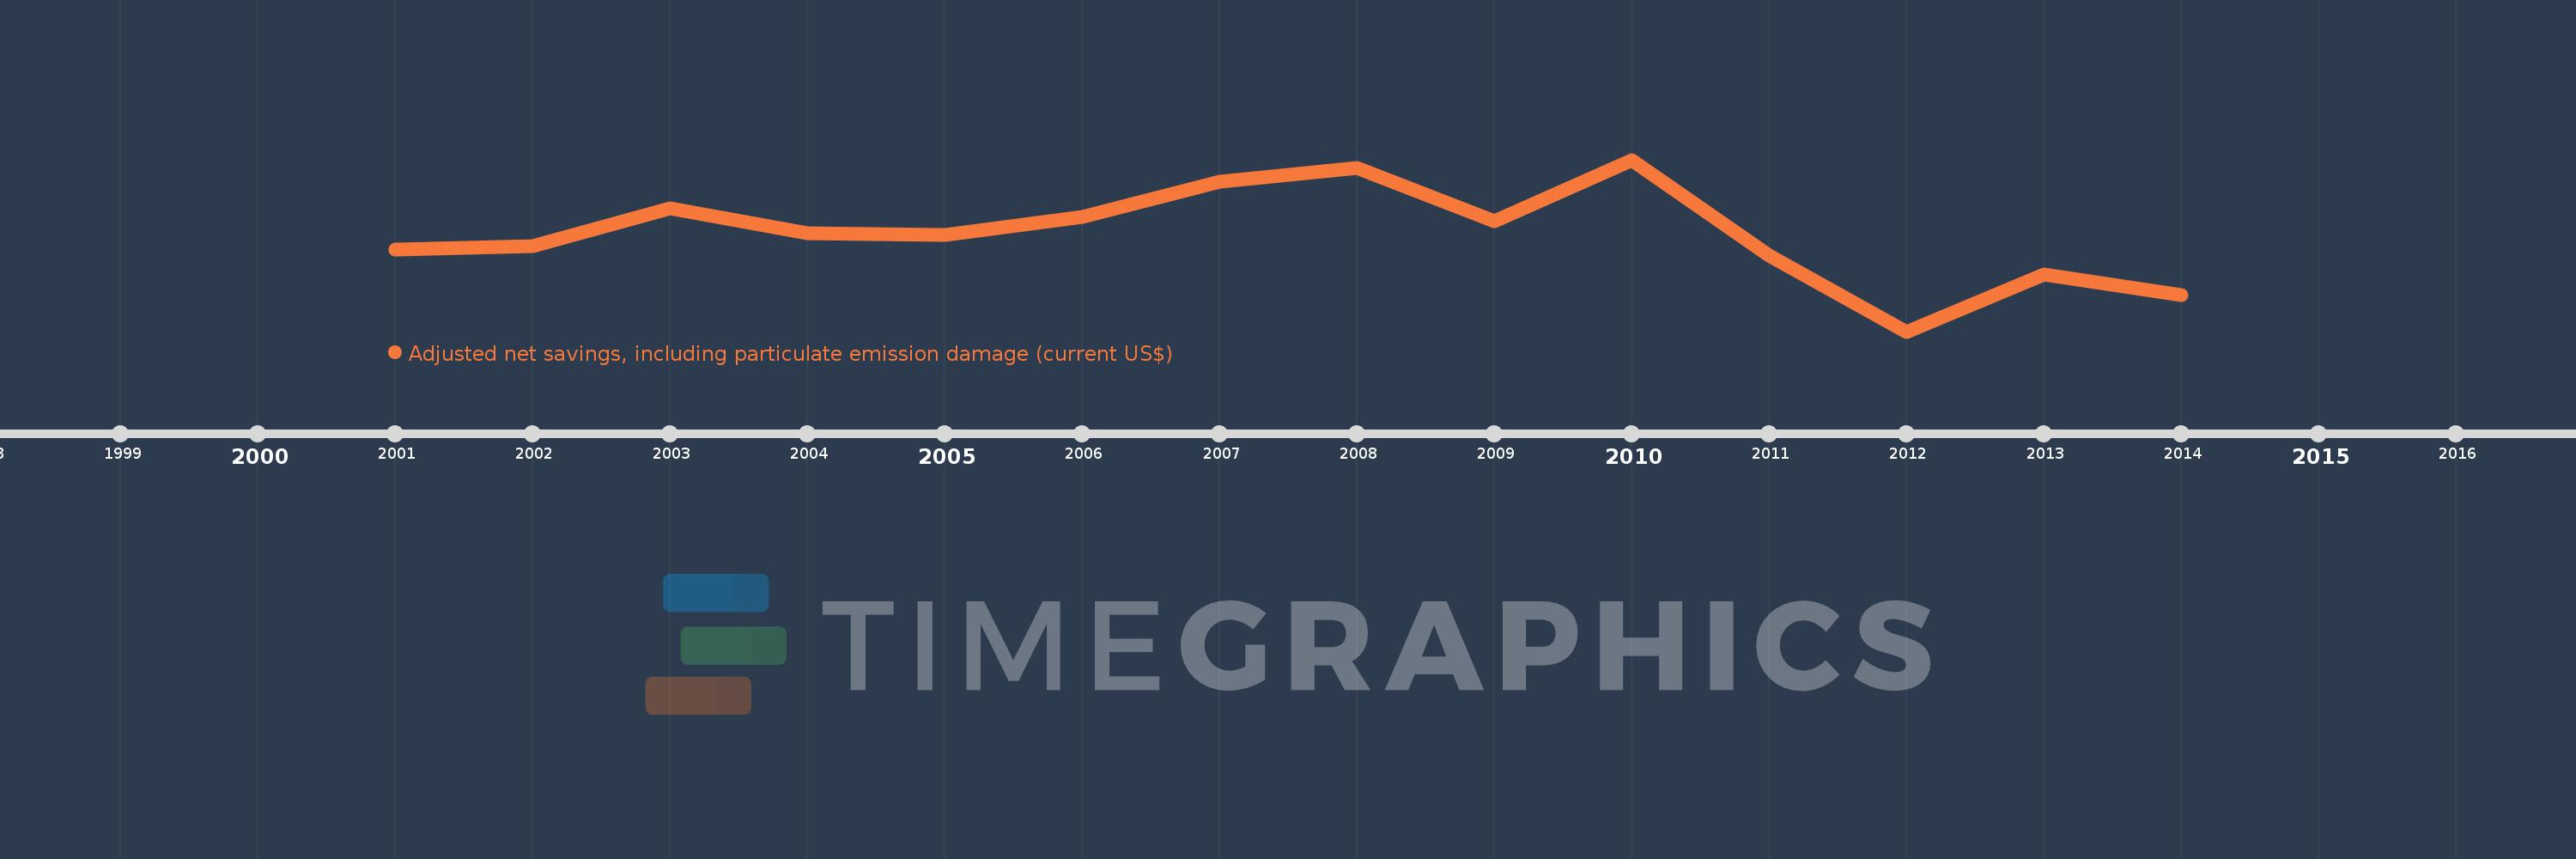
Questa scala temporale mostra un grafico dal 2001 anno al 2014 anno. Lao PDR. I dati fino ad 2000 anno non disponibili. Il numero di osservazioni attuali secondo i date: 14.
La fonte (nome):
Indicatori dello sviluppo mondiale
La fonte (organizzazione):
World Bank staff estimates based on sources and methods in World Bank's "The Changing Wealth of Nations: Measuring Sustainable Development in the New Millennium" (2011).
Categorie:
Economy & Growth, Environment
sono stati aggiornati
23 apr 2017 anni
Indicatori delle variazioni dei valori per anni
In media:
-204.809 Mln
Minima:
-575.645 Mln
1 gen 2012 anni
Massimo:
76.488 Mln
1 gen 2010 anni
Alla data di osservazione
Valore
Variazione assoluta
La variazione rispetto al valore precedente
1 gen 2001 anni
-264.214 Mln
-264.214 Mln
0.0%
1 gen 2002 anni
-249.728 Mln
+14.486 Mln
-5.48%
1 gen 2003 anni
-108.133 Mln
+141.595 Mln
-56.7%
1 gen 2004 anni
-201.933 Mln
-93.8 Mln
86.75%
1 gen 2005 anni
-209.754 Mln
-7.821 Mln
3.87%
1 gen 2006 anni
-139.084 Mln
+70.67 Mln
-33.69%
1 gen 2007 anni
-5.628 Mln
+133.456 Mln
-95.95%
1 gen 2008 anni
44.074 Mln
+49.702 Mln
-883.15%
1 gen 2009 anni
-155.136 Mln
-199.21 Mln
-451.99%
1 gen 2010 anni
76.488 Mln
+231.623 Mln
-149.3%
1 gen 2011 anni
-285.524 Mln
-362.012 Mln
-473.29%
1 gen 2012 anni
-575.645 Mln
-290.121 Mln
101.61%
1 gen 2013 anni
-357.623 Mln
+218.022 Mln
-37.87%
1 gen 2014 anni
-435.487 Mln
-77.863 Mln
21.77%
Classificazione dei paesi secondo i statistiche attuali per anni