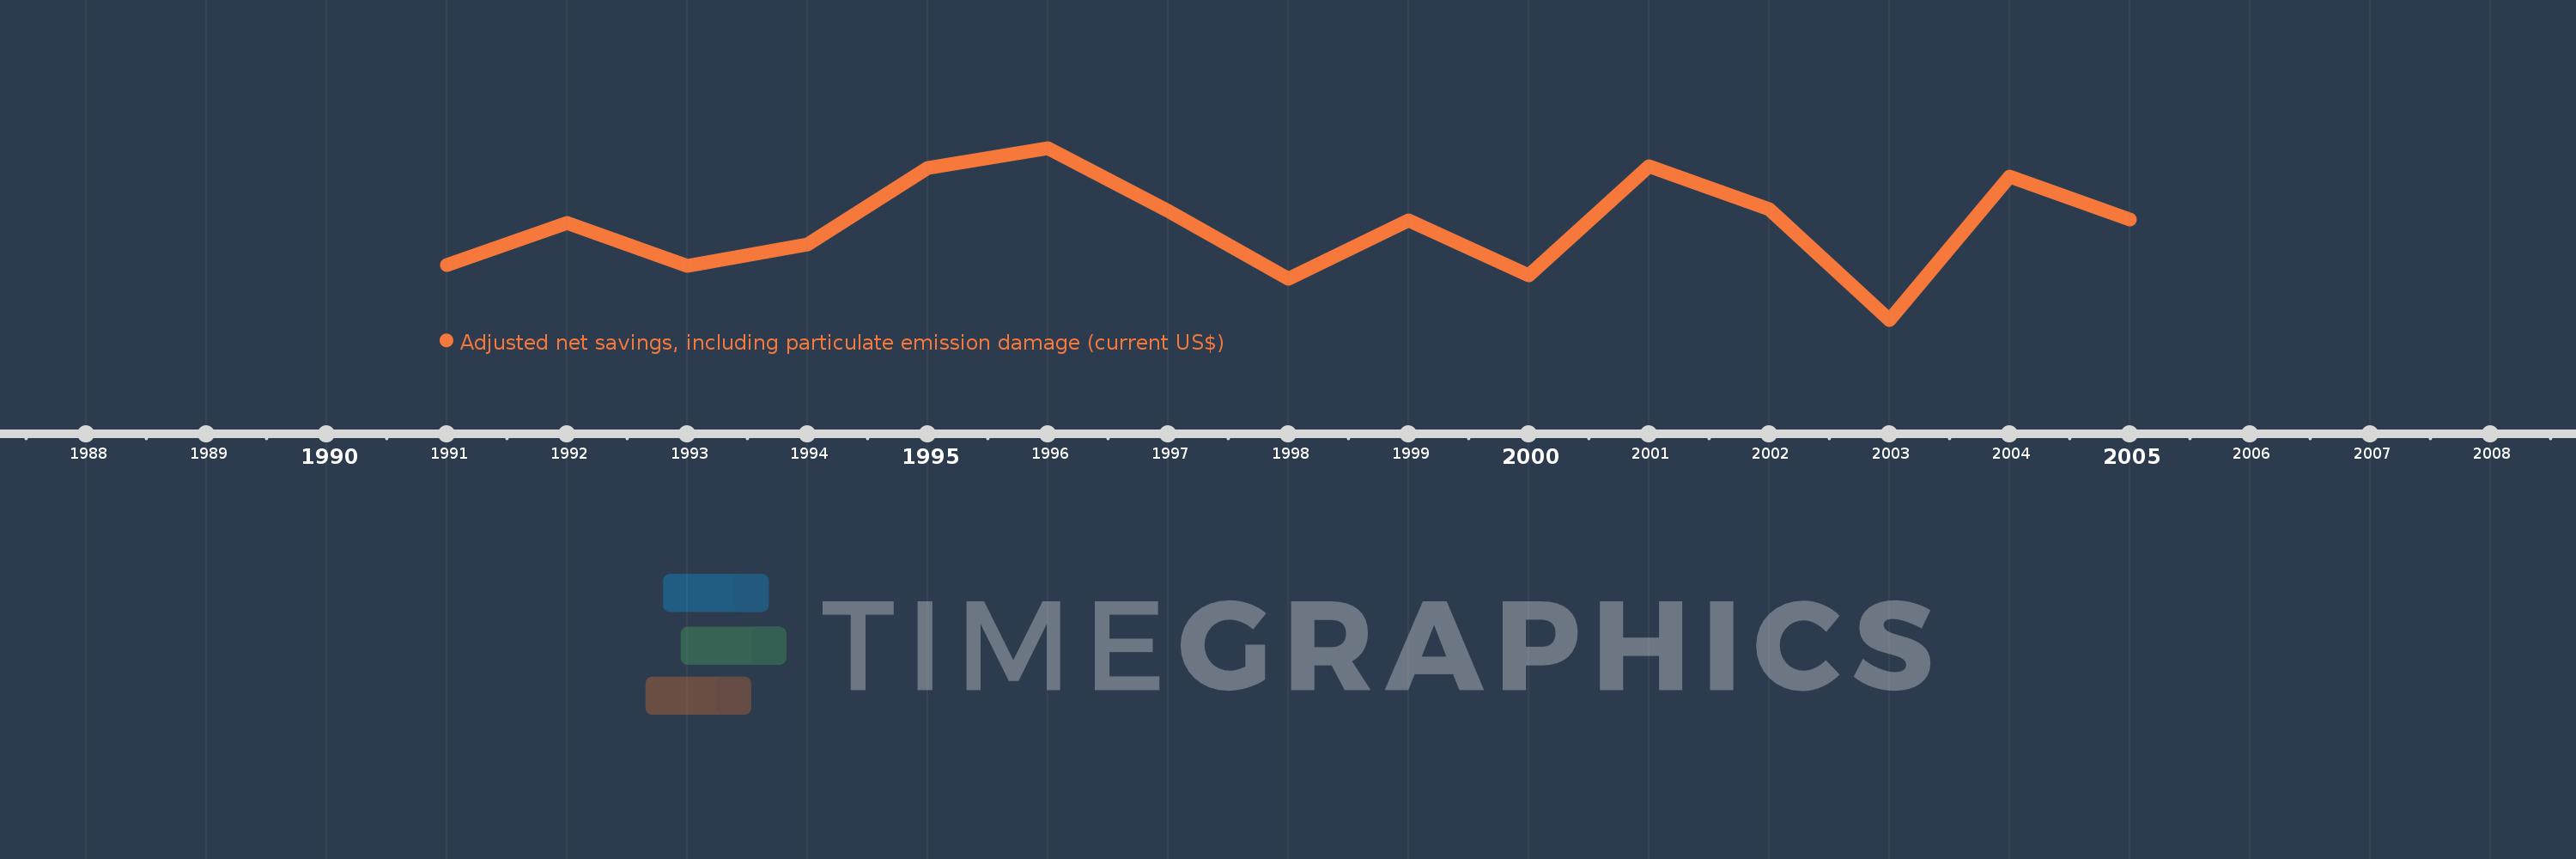
Questa scala temporale mostra un grafico dal 1991 anno al 2005 anno. Papua New Guinea. I dati fino ad 1990 anno non disponibili. Il numero di osservazioni attuali secondo i date: 15.
La fonte (nome):
Indicatori dello sviluppo mondiale
La fonte (organizzazione):
World Bank staff estimates based on sources and methods in World Bank's "The Changing Wealth of Nations: Measuring Sustainable Development in the New Millennium" (2011).
Categorie:
Economy & Growth, Environment
sono stati aggiornati
23 apr 2017 anni
Indicatori delle variazioni dei valori per anni
In media:
130.386 Mln
Minima:
-173.248 Mln
1 gen 2003 anni
Massimo:
383.854 Mln
1 gen 1996 anni
Alla data di osservazione
Valore
Variazione assoluta
La variazione rispetto al valore precedente
1 gen 1991 anni
4.103 Mln
+4.103 Mln
0.0%
1 gen 1992 anni
140.401 Mln
+136.297 Mln
3.32 Mille.%
1 gen 1993 anni
1.634 Mln
-138.767 Mln
-98.84%
1 gen 1994 anni
70.244 Mln
+68.61 Mln
4.2 Mille.%
1 gen 1995 anni
318.272 Mln
+248.028 Mln
353.1%
1 gen 1996 anni
383.854 Mln
+65.583 Mln
20.61%
1 gen 1997 anni
178.969 Mln
-204.886 Mln
-53.38%
1 gen 1998 anni
-41.466 Mln
-220.435 Mln
-123.17%
1 gen 1999 anni
149.872 Mln
+191.339 Mln
-461.43%
1 gen 2000 anni
-28.759 Mln
-178.631 Mln
-119.19%
1 gen 2001 anni
323.739 Mln
+352.498 Mln
-1.23 Mille.%
1 gen 2002 anni
184.532 Mln
-139.208 Mln
-43.0%
1 gen 2003 anni
-173.248 Mln
-357.78 Mln
-193.89%
1 gen 2004 anni
291.159 Mln
+464.407 Mln
-268.06%
1 gen 2005 anni
152.484 Mln
-138.675 Mln
-47.63%
Classificazione dei paesi secondo i statistiche attuali per anni