Questa scala temporale mostra un grafico dal 2000 anno al 2015 anno. Latvia. I dati fino ad 1999 anno non disponibili. Il numero di osservazioni attuali secondo i date: 16.
La fonte (nome):
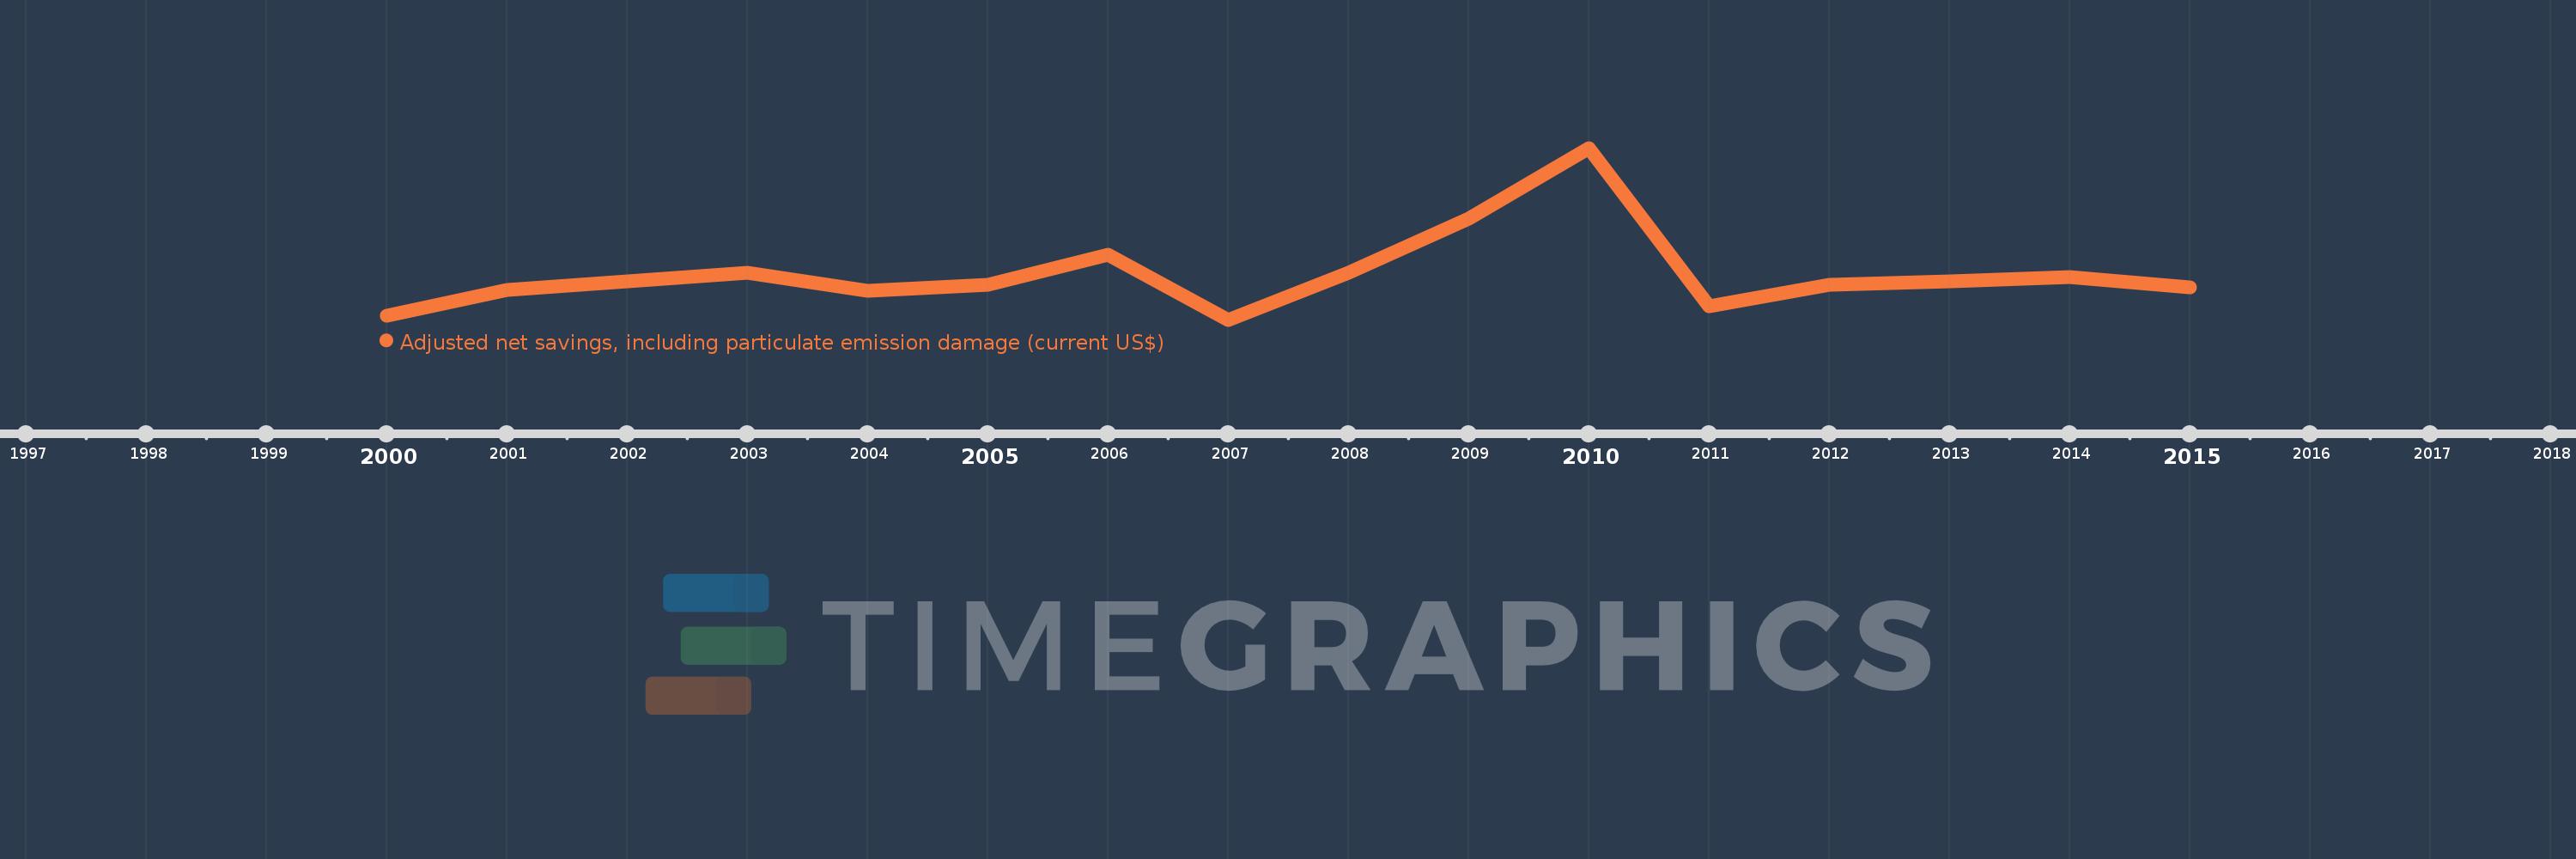
Indicatori dello sviluppo mondiale
La fonte (organizzazione):
World Bank staff estimates based on sources and methods in World Bank's "The Changing Wealth of Nations: Measuring Sustainable Development in the New Millennium" (2011).
Categorie:
Economy & Growth, Environment
sono stati aggiornati
23 apr 2017 anni
Indicatori delle variazioni dei valori per anni
In media:
303.66 Mln
Minima:
-477.871 Mln
1 gen 2007 anni
Massimo:
2.464 Mlrd
1 gen 2010 anni
Alla data di osservazione
Valore
Variazione assoluta
La variazione rispetto al valore precedente
1 gen 2000 anni
-412.23 Mln
-412.23 Mln
0.0%
1 gen 2001 anni
35.491 Mln
+447.721 Mln
-108.61%
1 gen 2002 anni
176.659 Mln
+141.168 Mln
397.76%
1 gen 2003 anni
321.613 Mln
+144.954 Mln
82.05%
1 gen 2004 anni
13.879 Mln
-307.734 Mln
-95.68%
1 gen 2005 anni
127.376 Mln
+113.497 Mln
817.79%
1 gen 2006 anni
639.771 Mln
+512.395 Mln
402.27%
1 gen 2007 anni
-477.871 Mln
-1.118 Mlrd
-174.69%
1 gen 2008 anni
332.508 Mln
+810.379 Mln
-169.58%
1 gen 2009 anni
1.26 Mlrd
+927.463 Mln
278.93%
1 gen 2010 anni
2.464 Mlrd
+1.204 Mlrd
95.57%
1 gen 2011 anni
-245.486 Mln
-2.71 Mlrd
-109.96%
1 gen 2012 anni
123.856 Mln
+369.342 Mln
-150.45%
1 gen 2013 anni
172.471 Mln
+48.615 Mln
39.25%
1 gen 2014 anni
256.165 Mln
+83.693 Mln
48.53%
1 gen 2015 anni
70.271 Mln
-185.894 Mln
-72.57%
Classificazione dei paesi secondo i statistiche attuali per anni