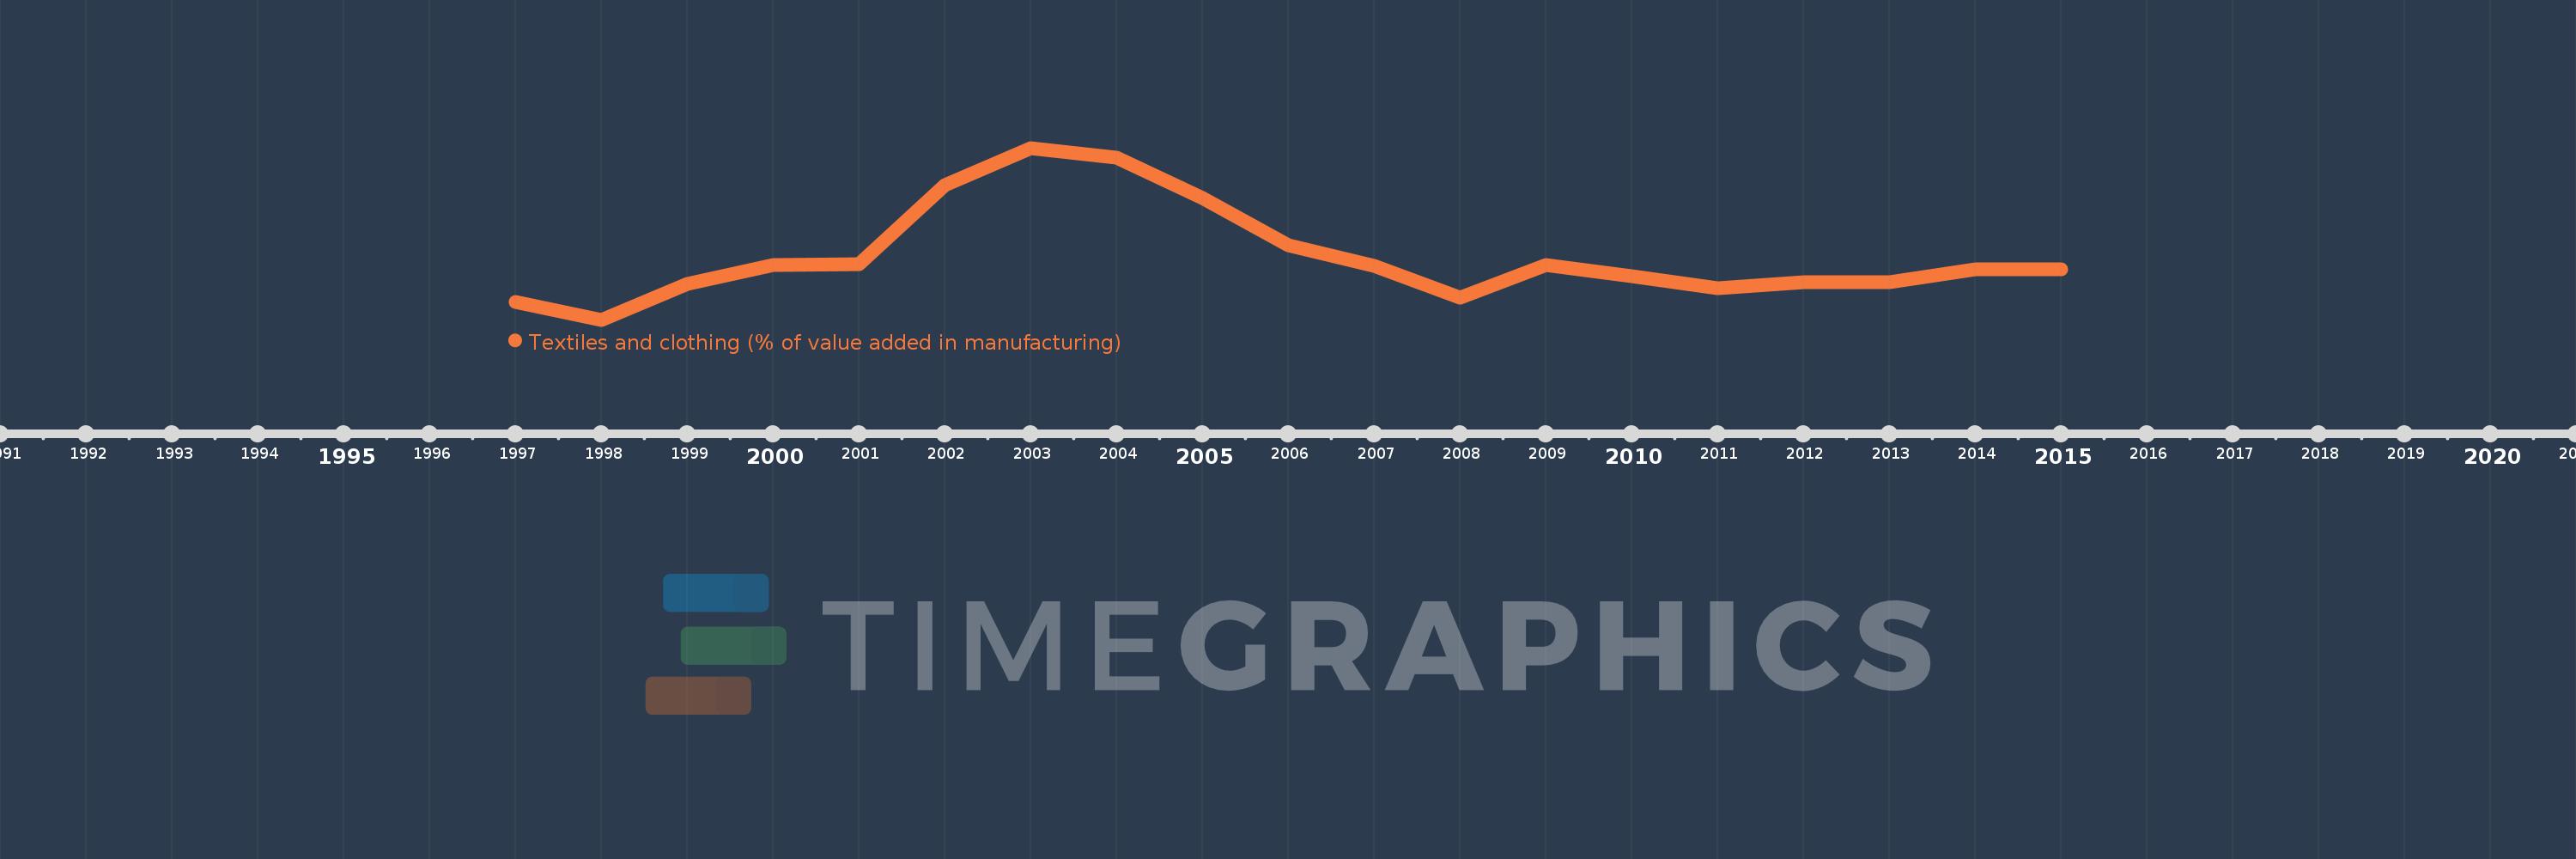
Questa scala temporale mostra un grafico dal 1997 anno al 2015 anno. Bulgaria. I dati fino ad 1996 anno non disponibili. Il numero di osservazioni attuali secondo i date: 19.
La fonte (nome):
Indicatori dello sviluppo mondiale
La fonte (organizzazione):
United Nations Industrial Development Organization, International Yearbook of Industrial Statistics.
Categorie:
Economy & Growth
sono stati aggiornati
23 apr 2017 anni
Indicatori delle variazioni dei valori per anni
In media:
14.079
Minima:
10.879
1 gen 1998 anni
Massimo:
19.508
1 gen 2003 anni
Alla data di osservazione
Valore
Variazione assoluta
La variazione rispetto al valore precedente
1 gen 1997 anni
11.773
+11.773
0.0%
1 gen 1998 anni
10.879
-0.894
-7.59%
1 gen 1999 anni
12.663
+1.784
16.4%
1 gen 2000 anni
13.612
+0.948
7.49%
1 gen 2001 anni
13.669
+0.057
0.42%
1 gen 2002 anni
17.656
+3.987
29.17%
1 gen 2003 anni
19.508
+1.852
10.49%
1 gen 2004 anni
19.028
-0.48
-2.46%
1 gen 2005 anni
17.002
-2.026
-10.65%
1 gen 2006 anni
14.603
-2.399
-14.11%
1 gen 2007 anni
13.602
-1.002
-6.86%
1 gen 2008 anni
12.008
-1.593
-11.71%
1 gen 2009 anni
13.646
+1.638
13.64%
1 gen 2010 anni
13.06
-0.586
-4.3%
1 gen 2011 anni
12.461
-0.598
-4.58%
1 gen 2012 anni
12.756
+0.295
2.37%
1 gen 2013 anni
12.777
+0.021
0.17%
1 gen 2014 anni
13.398
+0.62
4.85%
1 gen 2015 anni
13.398
0.0
0.0%
Classificazione dei paesi secondo i statistiche attuali per anni