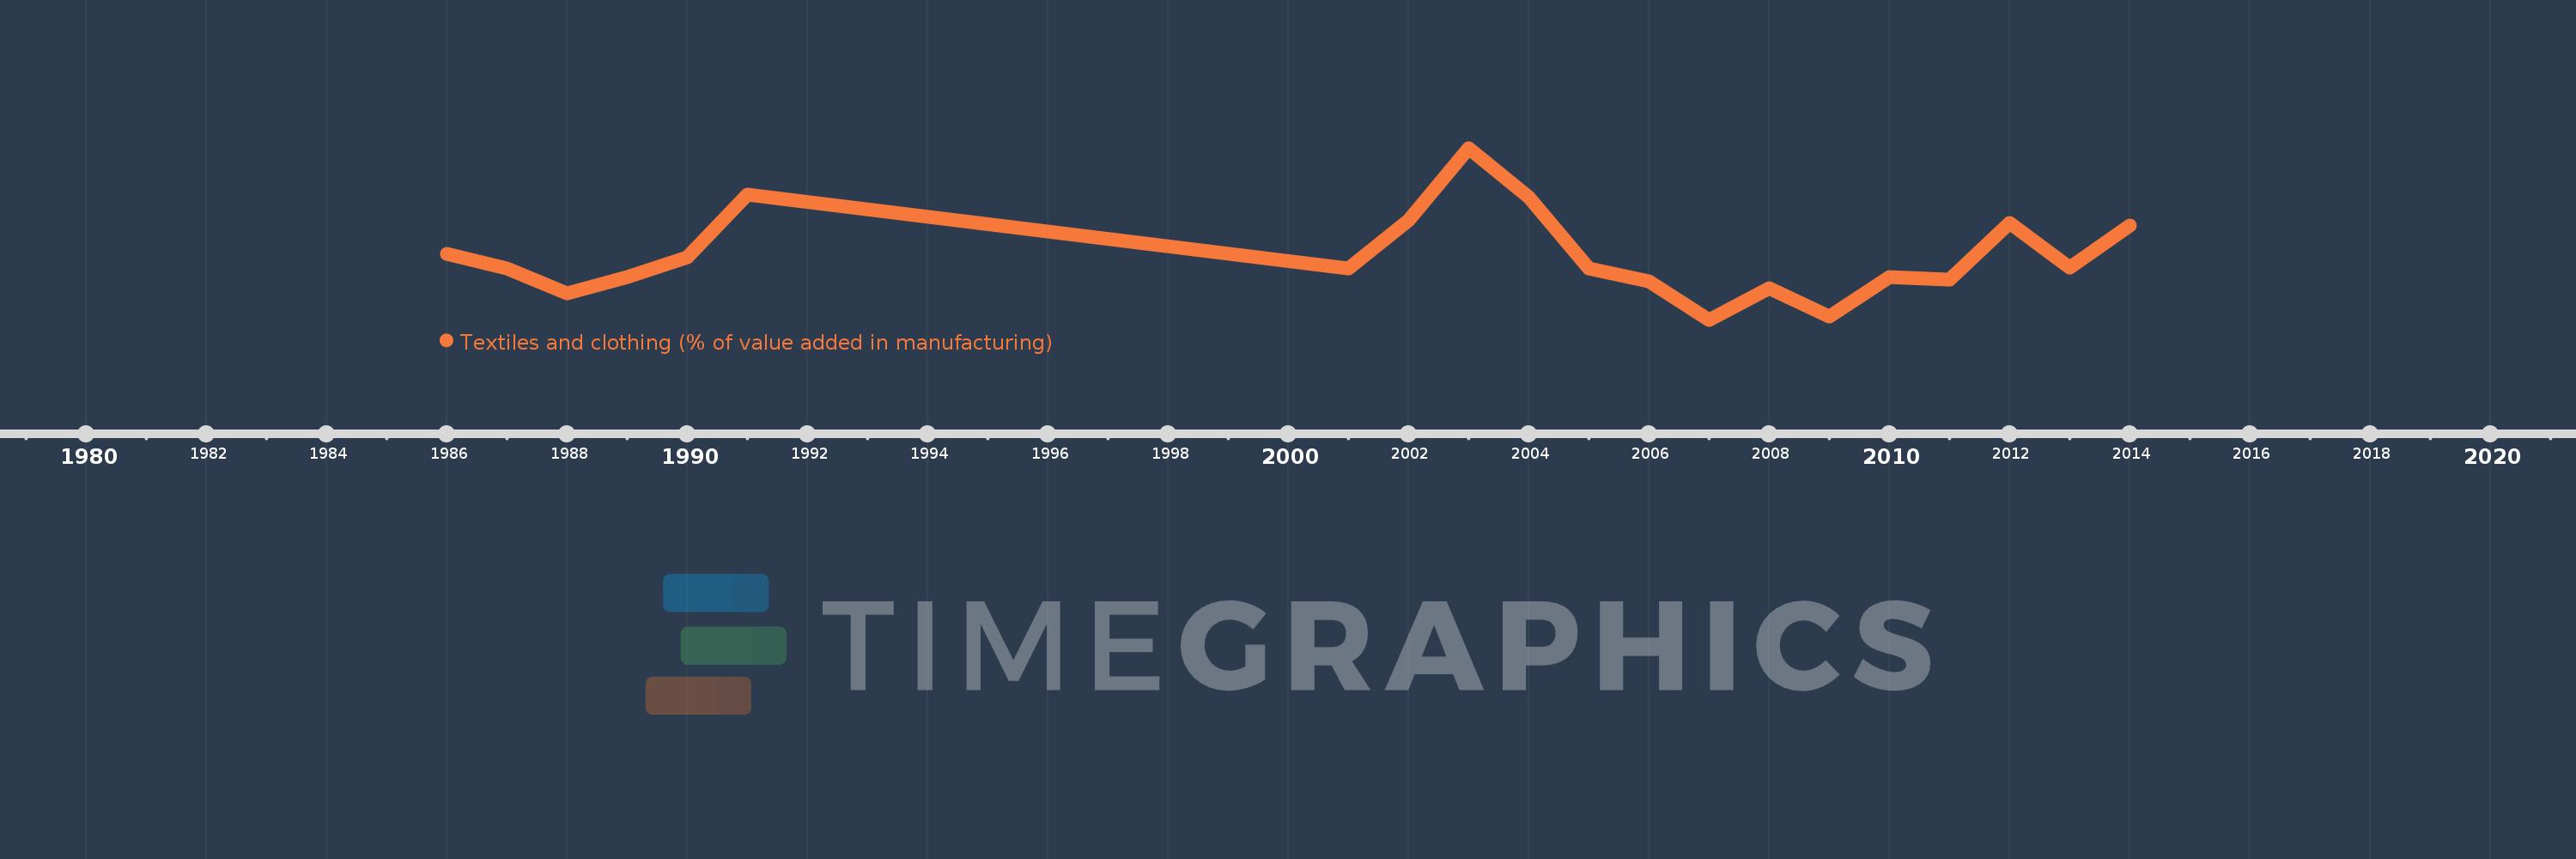
Questa scala temporale mostra un grafico dal 1986 anno al 2014 anno. Albania. I dati fino ad 1985 anno non disponibili. Il numero di osservazioni attuali secondo i date: 20.
La fonte (nome):
Indicatori dello sviluppo mondiale
La fonte (organizzazione):
United Nations Industrial Development Organization, International Yearbook of Industrial Statistics.
Categorie:
Economy & Growth
sono stati aggiornati
23 apr 2017 anni
Indicatori delle variazioni dei valori per anni
In media:
27.539
Minima:
22.293
1 gen 2007 anni
Massimo:
36.486
1 gen 2003 anni
Alla data di osservazione
Valore
Variazione assoluta
La variazione rispetto al valore precedente
1 gen 1986 anni
27.75
+27.75
0.0%
1 gen 1987 anni
26.518
-1.232
-4.44%
1 gen 1988 anni
24.466
-2.052
-7.74%
1 gen 1989 anni
25.801
+1.335
5.46%
1 gen 1990 anni
27.475
+1.674
6.49%
1 gen 1991 anni
32.659
+5.184
18.87%
1 gen 2001 anni
26.54
-6.119
-18.74%
1 gen 2002 anni
30.535
+3.995
15.05%
1 gen 2003 anni
36.486
+5.951
19.49%
1 gen 2004 anni
32.431
-4.055
-11.12%
1 gen 2005 anni
26.55
-5.881
-18.13%
1 gen 2006 anni
25.498
-1.052
-3.96%
1 gen 2007 anni
22.293
-3.204
-12.57%
1 gen 2008 anni
24.869
+2.576
11.55%
1 gen 2009 anni
22.563
-2.306
-9.27%
1 gen 2010 anni
25.795
+3.233
14.33%
1 gen 2011 anni
25.594
-0.201
-0.78%
1 gen 2012 anni
30.312
+4.718
18.43%
1 gen 2013 anni
26.579
-3.733
-12.32%
1 gen 2014 anni
30.076
+3.498
13.16%
Classificazione dei paesi secondo i statistiche attuali per anni