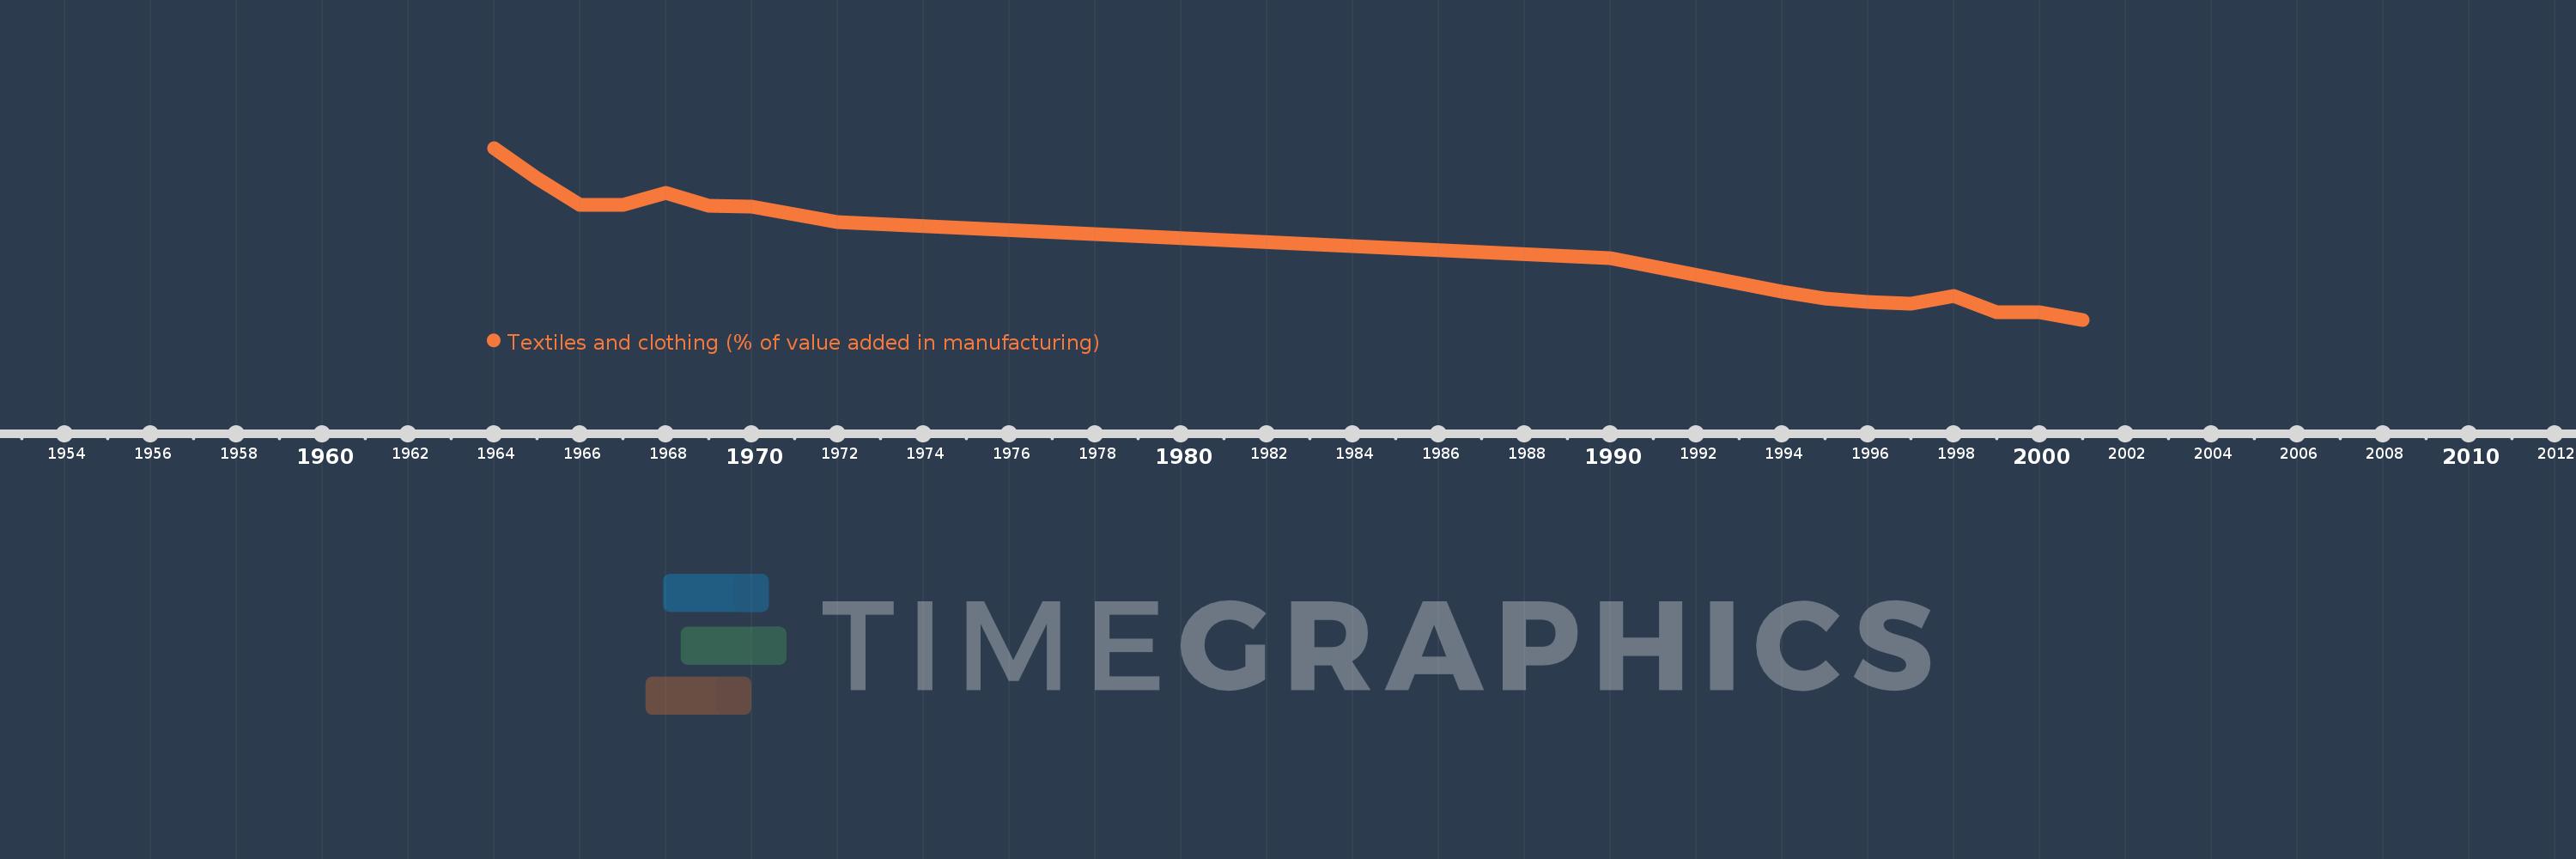
Questa scala temporale mostra un grafico dal 1964 anno al 2001 anno. Uganda. I dati fino ad 1963 anno non disponibili. Il numero di osservazioni attuali secondo i date: 17.
La fonte (nome):
Indicatori dello sviluppo mondiale
La fonte (organizzazione):
United Nations Industrial Development Organization, International Yearbook of Industrial Statistics.
Categorie:
Economy & Growth
sono stati aggiornati
23 apr 2017 anni
Indicatori delle variazioni dei valori per anni
In media:
15.675
Minima:
4.044
1 gen 2001 anni
Massimo:
32.893
1 gen 1964 anni
Alla data di osservazione
Valore
Variazione assoluta
La variazione rispetto al valore precedente
1 gen 1964 anni
32.893
+32.893
0.0%
1 gen 1965 anni
27.844
-5.05
-15.35%
1 gen 1966 anni
23.356
-4.487
-16.12%
1 gen 1967 anni
23.303
-0.054
-0.23%
1 gen 1968 anni
25.345
+2.042
8.76%
1 gen 1969 anni
23.191
-2.153
-8.5%
1 gen 1970 anni
22.97
-0.222
-0.96%
1 gen 1972 anni
20.419
-2.55
-11.1%
1 gen 1990 anni
14.36
-6.06
-29.68%
1 gen 1994 anni
8.747
-5.612
-39.08%
1 gen 1995 anni
7.558
-1.189
-13.59%
1 gen 1996 anni
7.015
-0.543
-7.19%
1 gen 1997 anni
6.749
-0.266
-3.8%
1 gen 1998 anni
8.003
+1.254
18.59%
1 gen 1999 anni
5.358
-2.645
-33.05%
1 gen 2000 anni
5.311
-0.046
-0.87%
1 gen 2001 anni
4.044
-1.267
-23.86%
Classificazione dei paesi secondo i statistiche attuali per anni