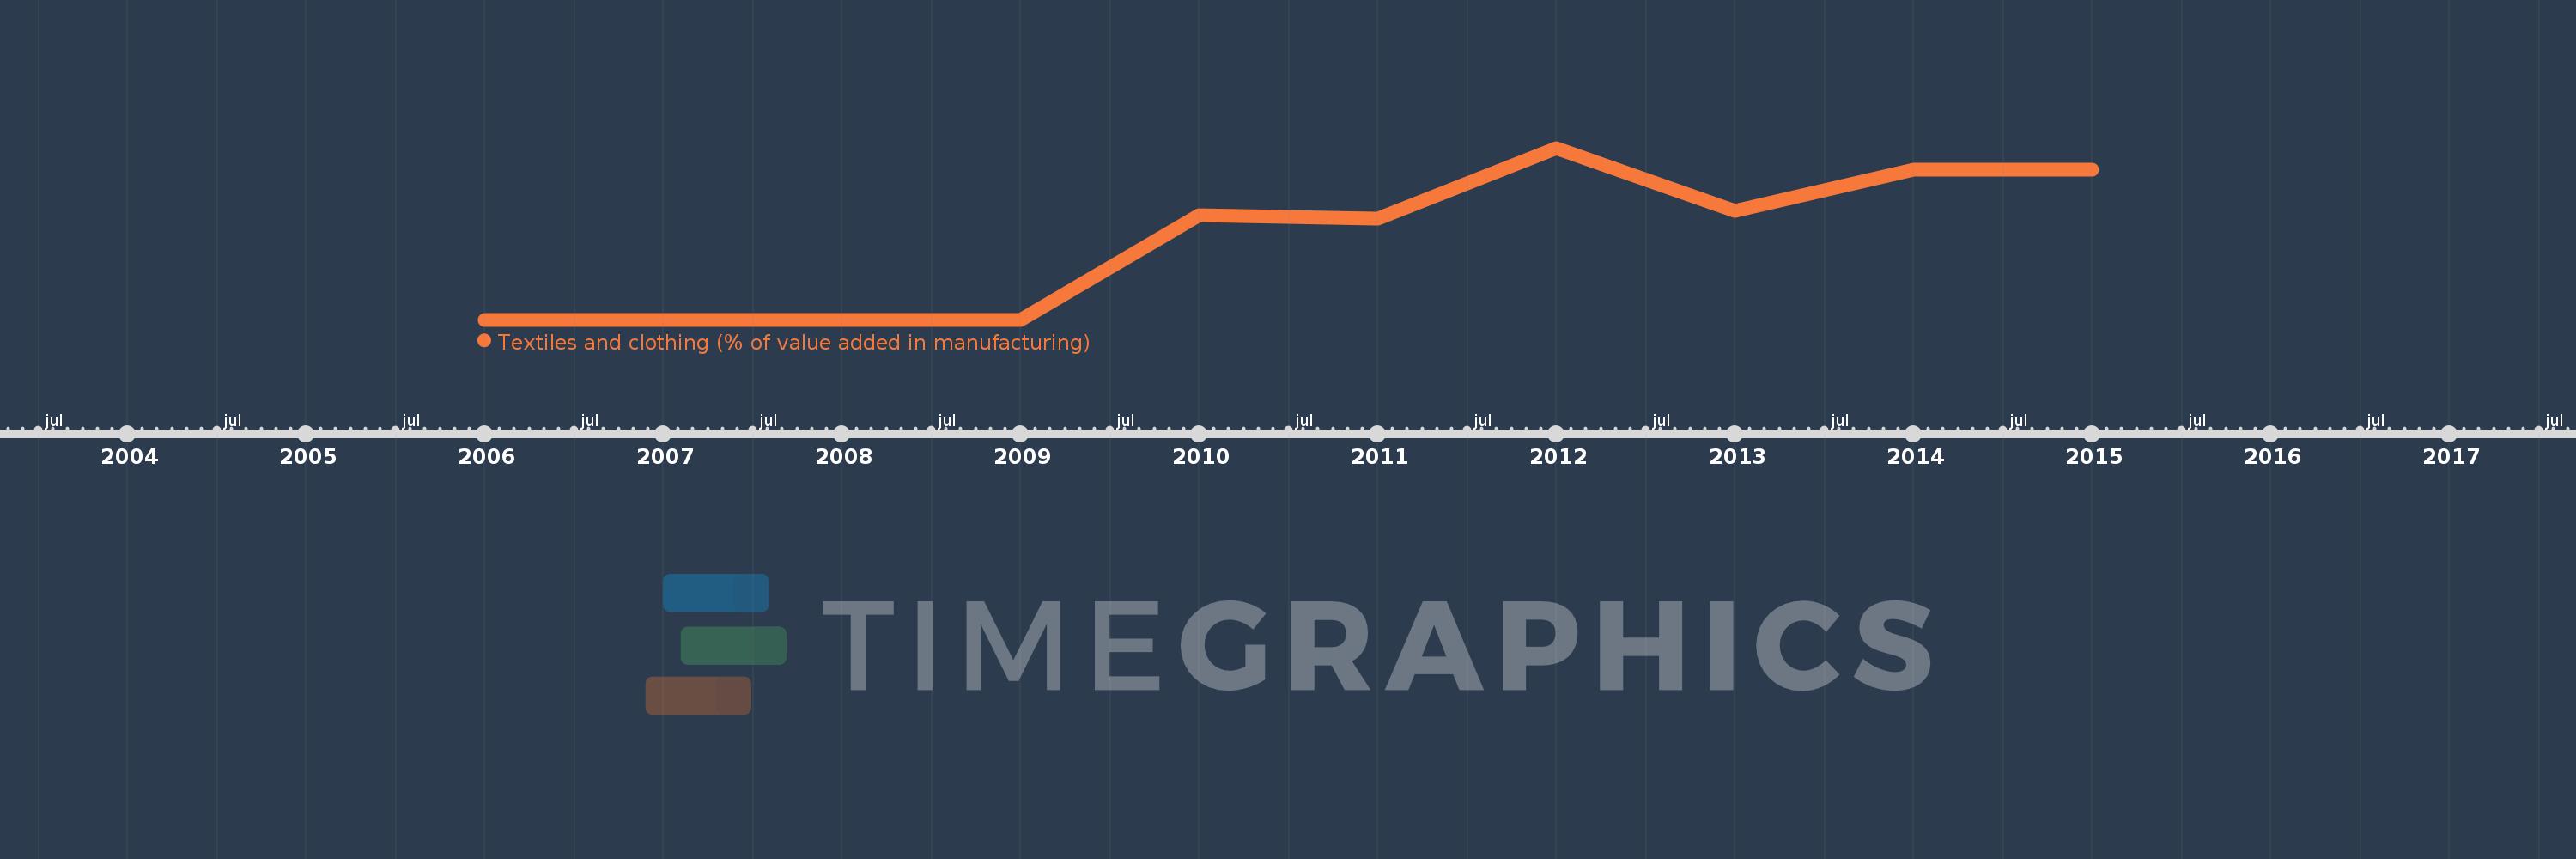
Questa scala temporale mostra un grafico dal 2006 anno al 2015 anno. Belarus. I dati fino ad 2005 anno non disponibili. Il numero di osservazioni attuali secondo i date: 10.
La fonte (nome):
Indicatori dello sviluppo mondiale
La fonte (organizzazione):
United Nations Industrial Development Organization, International Yearbook of Industrial Statistics.
Categorie:
Economy & Growth
sono stati aggiornati
23 apr 2017 anni
Indicatori delle variazioni dei valori per anni
In media:
6.261
Minima:
5.533
1 gen 2008 anni
Massimo:
7.124
1 gen 2012 anni
Alla data di osservazione
Valore
Variazione assoluta
La variazione rispetto al valore precedente
1 gen 2006 anni
5.533
+5.533
0.0%
1 gen 2007 anni
5.533
0.0
0.0%
1 gen 2008 anni
5.533
0.0
0.0%
1 gen 2009 anni
5.533
+0.0
0.0%
1 gen 2010 anni
6.503
+0.97
17.52%
1 gen 2011 anni
6.469
-0.034
-0.52%
1 gen 2012 anni
7.124
+0.655
10.13%
1 gen 2013 anni
6.537
-0.587
-8.25%
1 gen 2014 anni
6.92
+0.383
5.86%
1 gen 2015 anni
6.92
0.0
0.0%
Classificazione dei paesi secondo i statistiche attuali per anni