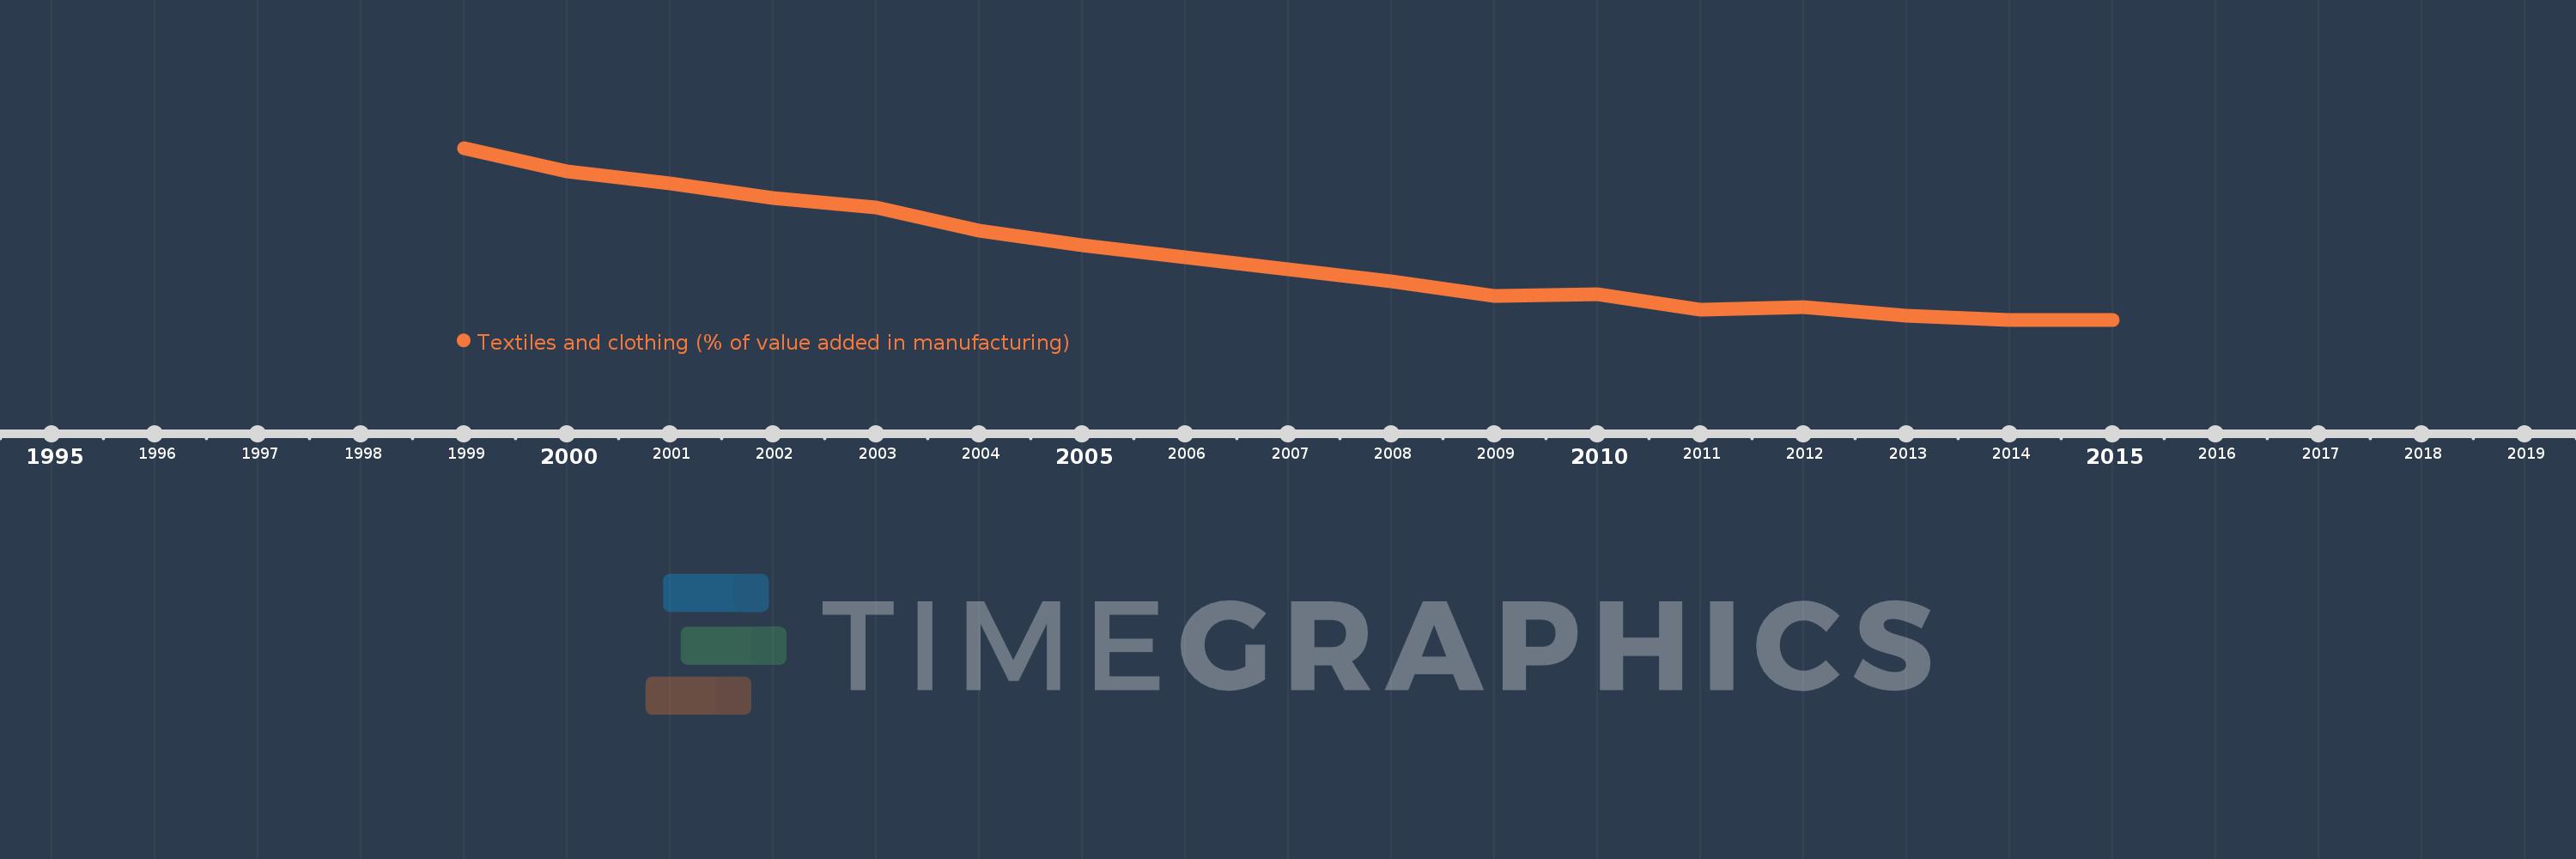
Questa scala temporale mostra un grafico dal 1999 anno al 2015 anno. Germany. I dati fino ad 1998 anno non disponibili. Il numero di osservazioni attuali secondo i date: 17.
La fonte (nome):
Indicatori dello sviluppo mondiale
La fonte (organizzazione):
United Nations Industrial Development Organization, International Yearbook of Industrial Statistics.
Categorie:
Economy & Growth
sono stati aggiornati
23 apr 2017 anni
Indicatori delle variazioni dei valori per anni
In media:
1.786
Minima:
1.361
1 gen 2015 anni
Massimo:
2.51
1 gen 1999 anni
Alla data di osservazione
Valore
Variazione assoluta
La variazione rispetto al valore precedente
1 gen 1999 anni
2.51
+2.51
0.0%
1 gen 2000 anni
2.356
-0.153
-6.11%
1 gen 2001 anni
2.275
-0.081
-3.45%
1 gen 2002 anni
2.174
-0.101
-4.45%
1 gen 2003 anni
2.109
-0.065
-3.0%
1 gen 2004 anni
1.954
-0.154
-7.32%
1 gen 2005 anni
1.857
-0.097
-4.97%
1 gen 2006 anni
1.778
-0.079
-4.26%
1 gen 2007 anni
1.699
-0.079
-4.43%
1 gen 2008 anni
1.619
-0.081
-4.74%
1 gen 2009 anni
1.521
-0.098
-6.04%
1 gen 2010 anni
1.529
+0.008
0.51%
1 gen 2011 anni
1.426
-0.102
-6.69%
1 gen 2012 anni
1.448
+0.022
1.53%
1 gen 2013 anni
1.387
-0.061
-4.23%
1 gen 2014 anni
1.361
-0.026
-1.85%
1 gen 2015 anni
1.361
0.0
0.0%
Classificazione dei paesi secondo i statistiche attuali per anni