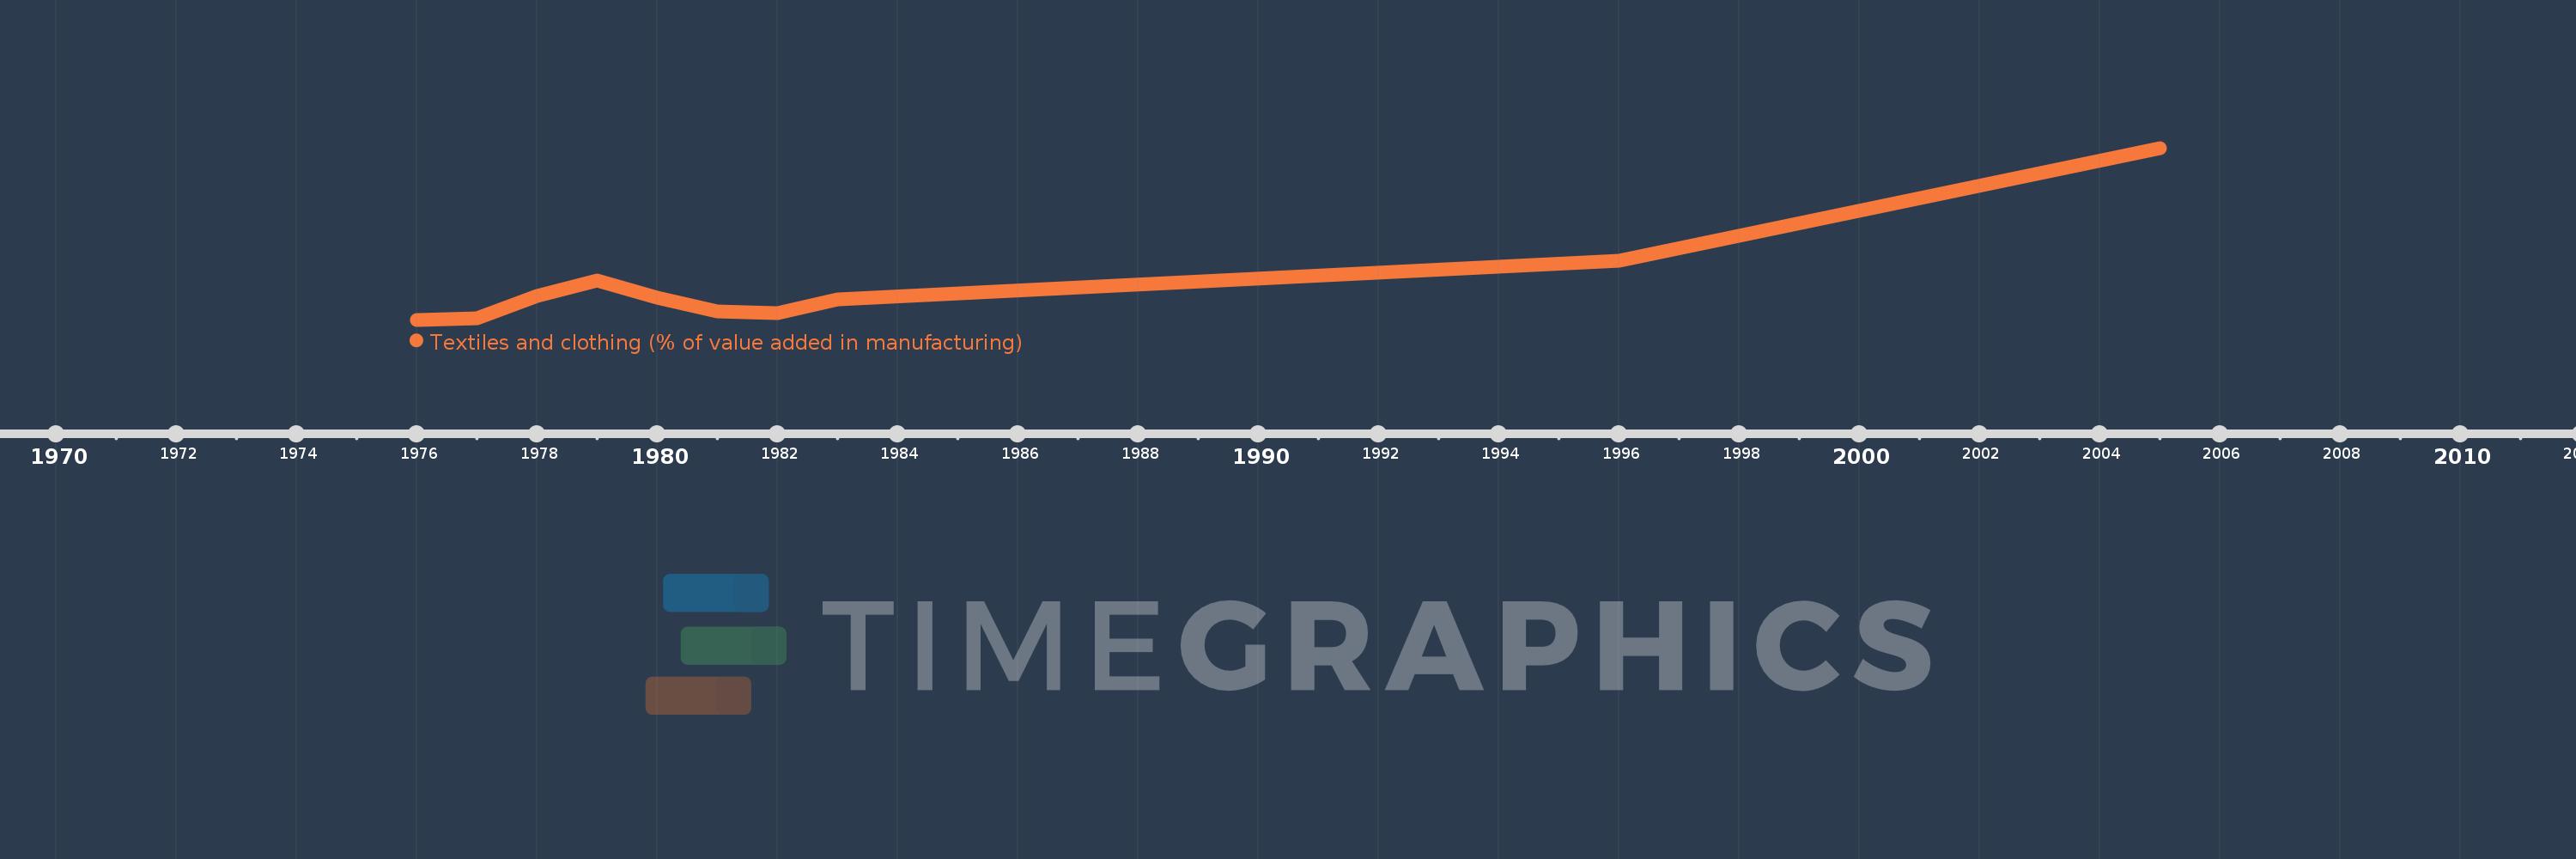
Questa scala temporale mostra un grafico dal 1976 anno al 2005 anno. Gambia, The. I dati fino ad 1975 anno non disponibili. Il numero di osservazioni attuali secondo i date: 10.
La fonte (nome):
Indicatori dello sviluppo mondiale
La fonte (organizzazione):
United Nations Industrial Development Organization, International Yearbook of Industrial Statistics.
Categorie:
Economy & Growth
sono stati aggiornati
23 apr 2017 anni
Indicatori delle variazioni dei valori per anni
In media:
5.238
Minima:
0.796
1 gen 1976 anni
Massimo:
22.486
1 gen 2005 anni
Alla data di osservazione
Valore
Variazione assoluta
La variazione rispetto al valore precedente
1 gen 1976 anni
0.796
+0.796
0.0%
1 gen 1977 anni
0.993
+0.197
24.75%
1 gen 1978 anni
3.807
+2.815
283.6%
1 gen 1979 anni
5.718
+1.911
50.19%
1 gen 1980 anni
3.546
-2.173
-37.99%
1 gen 1981 anni
1.852
-1.694
-47.76%
1 gen 1982 anni
1.578
-0.275
-14.82%
1 gen 1983 anni
3.315
+1.737
110.12%
1 gen 1996 anni
8.293
+4.978
150.15%
1 gen 2005 anni
22.486
+14.193
171.16%
Classificazione dei paesi secondo i statistiche attuali per anni