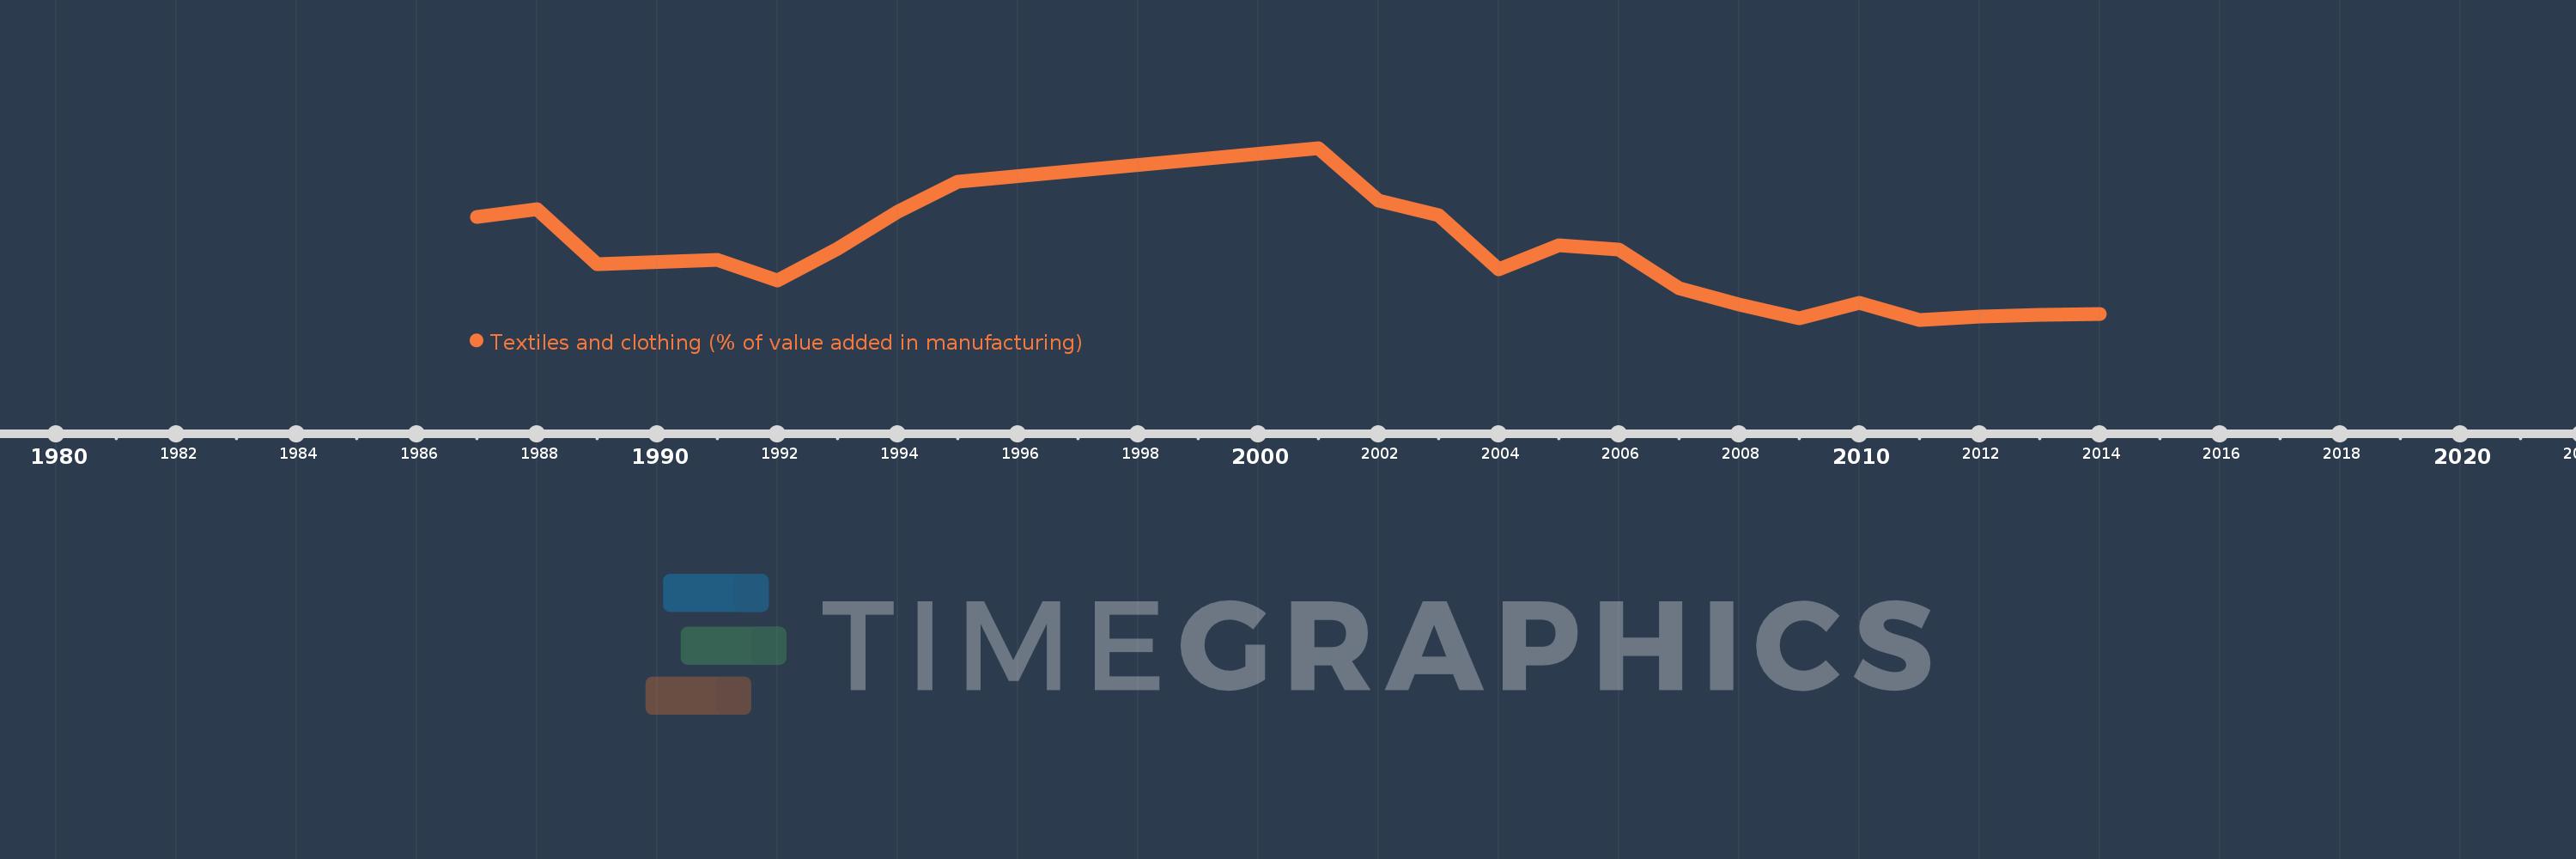
Questa scala temporale mostra un grafico dal 1987 anno al 2014 anno. Qatar. I dati fino ad 1986 anno non disponibili. Il numero di osservazioni attuali secondo i date: 22.
La fonte (nome):
Indicatori dello sviluppo mondiale
La fonte (organizzazione):
United Nations Industrial Development Organization, International Yearbook of Industrial Statistics.
Categorie:
Economy & Growth
sono stati aggiornati
23 apr 2017 anni
Indicatori delle variazioni dei valori per anni
In media:
3.309
Minima:
0.718
1 gen 2011 anni
Massimo:
7.958
1 gen 2001 anni
Alla data di osservazione
Valore
Variazione assoluta
La variazione rispetto al valore precedente
1 gen 1987 anni
5.056
+5.056
0.0%
1 gen 1988 anni
5.378
+0.323
6.38%
1 gen 1989 anni
3.063
-2.315
-43.05%
1 gen 1991 anni
3.234
+0.171
5.59%
1 gen 1992 anni
2.372
-0.863
-26.67%
1 gen 1993 anni
3.729
+1.357
57.23%
1 gen 1994 anni
5.285
+1.556
41.73%
1 gen 1995 anni
6.545
+1.259
23.83%
1 gen 2001 anni
7.958
+1.413
21.59%
1 gen 2002 anni
5.723
-2.235
-28.08%
1 gen 2003 anni
5.13
-0.593
-10.37%
1 gen 2004 anni
2.841
-2.289
-44.62%
1 gen 2005 anni
3.843
+1.002
35.29%
1 gen 2006 anni
3.663
-0.18
-4.68%
1 gen 2007 anni
2.031
-1.632
-44.56%
1 gen 2008 anni
1.346
-0.685
-33.73%
1 gen 2009 anni
0.762
-0.584
-43.36%
1 gen 2010 anni
1.419
+0.657
86.21%
1 gen 2011 anni
0.718
-0.702
-49.43%
1 gen 2012 anni
0.842
+0.124
17.33%
1 gen 2013 anni
0.914
+0.072
8.51%
1 gen 2014 anni
0.956
+0.042
4.6%
Classificazione dei paesi secondo i statistiche attuali per anni