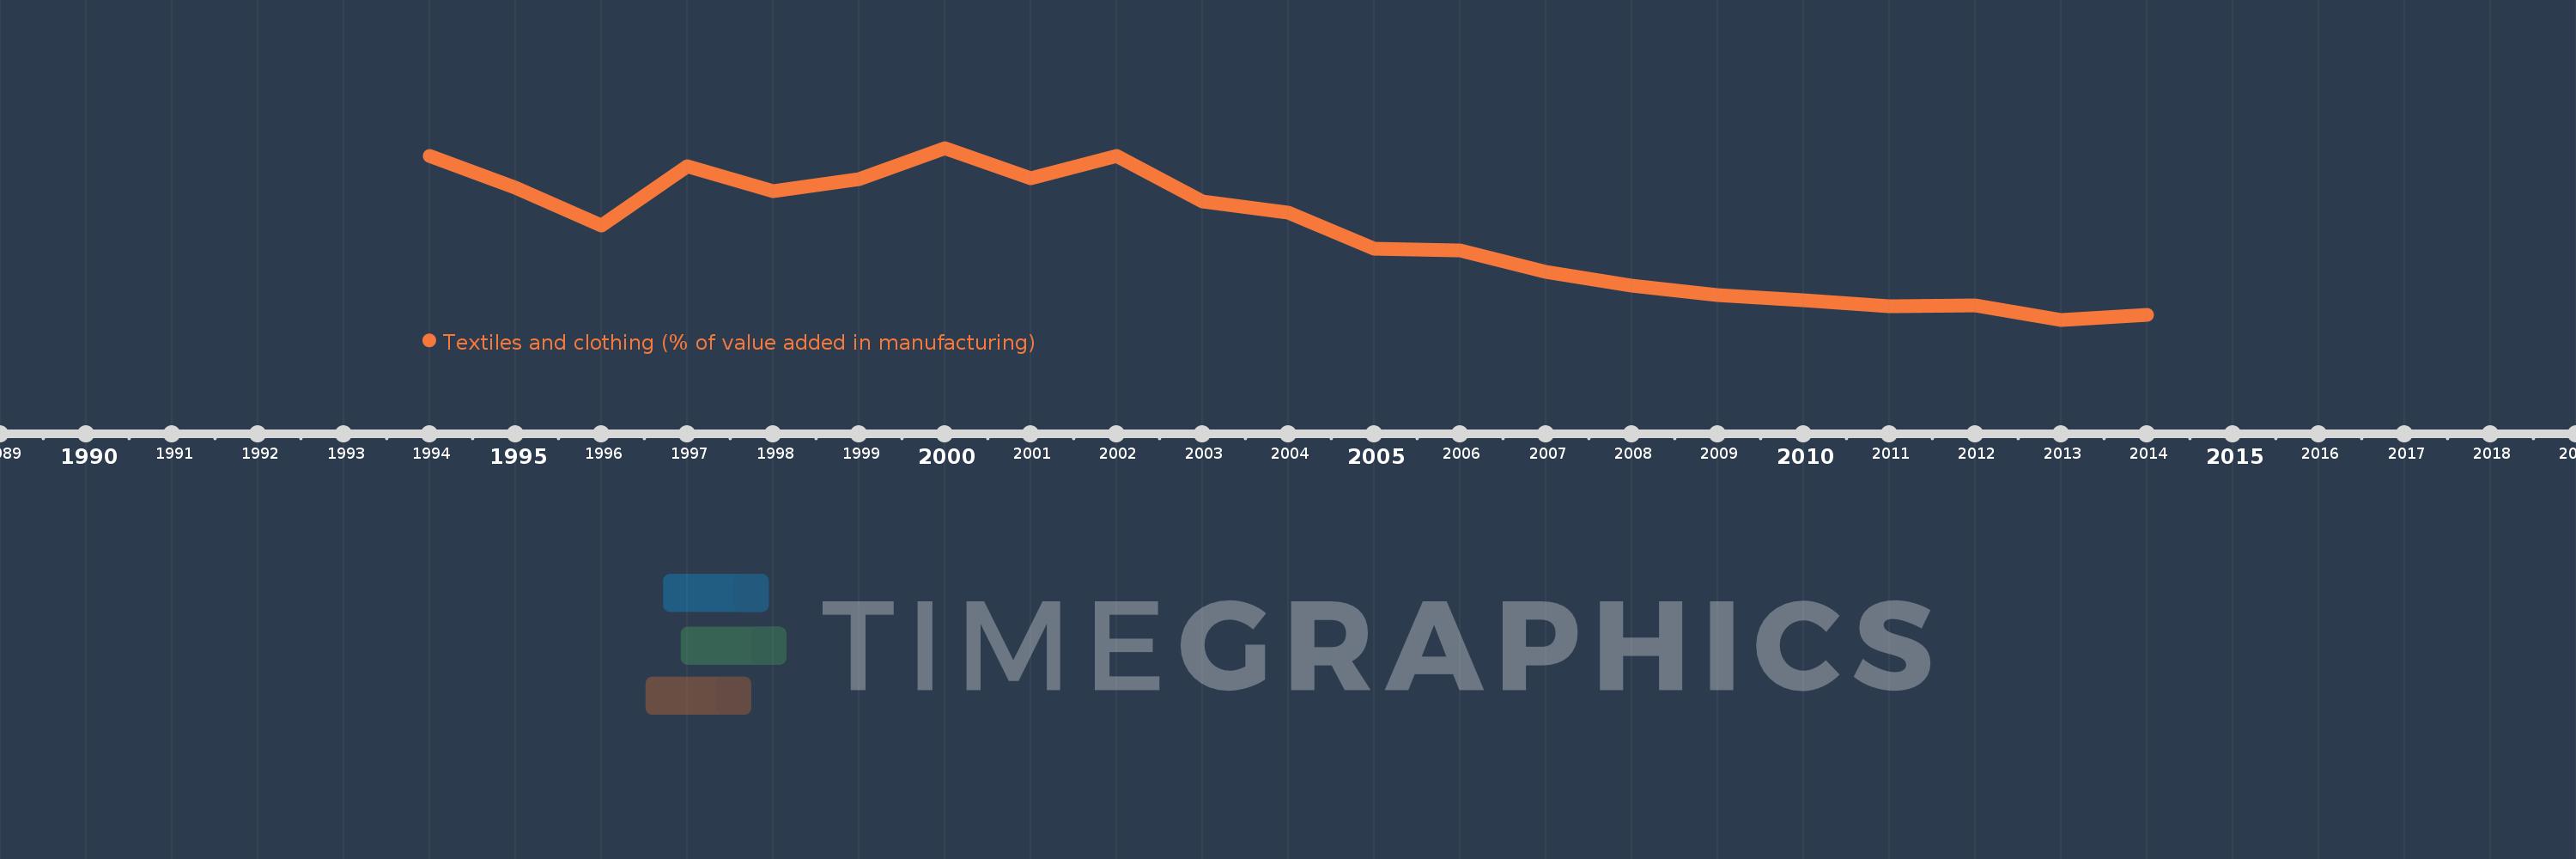
Questa scala temporale mostra un grafico dal 1994 anno al 2014 anno. Latvia. I dati fino ad 1993 anno non disponibili. Il numero di osservazioni attuali secondo i date: 21.
La fonte (nome):
Indicatori dello sviluppo mondiale
La fonte (organizzazione):
United Nations Industrial Development Organization, International Yearbook of Industrial Statistics.
Categorie:
Economy & Growth
sono stati aggiornati
23 apr 2017 anni
Indicatori delle variazioni dei valori per anni
In media:
8.696
Minima:
5.085
1 gen 2013 anni
Massimo:
12.26
1 gen 2000 anni
Alla data di osservazione
Valore
Variazione assoluta
La variazione rispetto al valore precedente
1 gen 1994 anni
11.943
+11.943
0.0%
1 gen 1995 anni
10.595
-1.349
-11.29%
1 gen 1996 anni
9.037
-1.557
-14.7%
1 gen 1997 anni
11.495
+2.458
27.2%
1 gen 1998 anni
10.466
-1.029
-8.95%
1 gen 1999 anni
10.95
+0.483
4.62%
1 gen 2000 anni
12.26
+1.311
11.97%
1 gen 2001 anni
11.007
-1.253
-10.22%
1 gen 2002 anni
11.922
+0.914
8.31%
1 gen 2003 anni
10.017
-1.905
-15.98%
1 gen 2004 anni
9.567
-0.45
-4.49%
1 gen 2005 anni
8.038
-1.529
-15.98%
1 gen 2006 anni
7.98
-0.058
-0.72%
1 gen 2007 anni
7.096
-0.884
-11.08%
1 gen 2008 anni
6.508
-0.588
-8.29%
1 gen 2009 anni
6.129
-0.379
-5.82%
1 gen 2010 anni
5.908
-0.222
-3.61%
1 gen 2011 anni
5.631
-0.277
-4.68%
1 gen 2012 anni
5.686
+0.054
0.97%
1 gen 2013 anni
5.085
-0.6
-10.56%
1 gen 2014 anni
5.287
+0.202
3.96%
Classificazione dei paesi secondo i statistiche attuali per anni