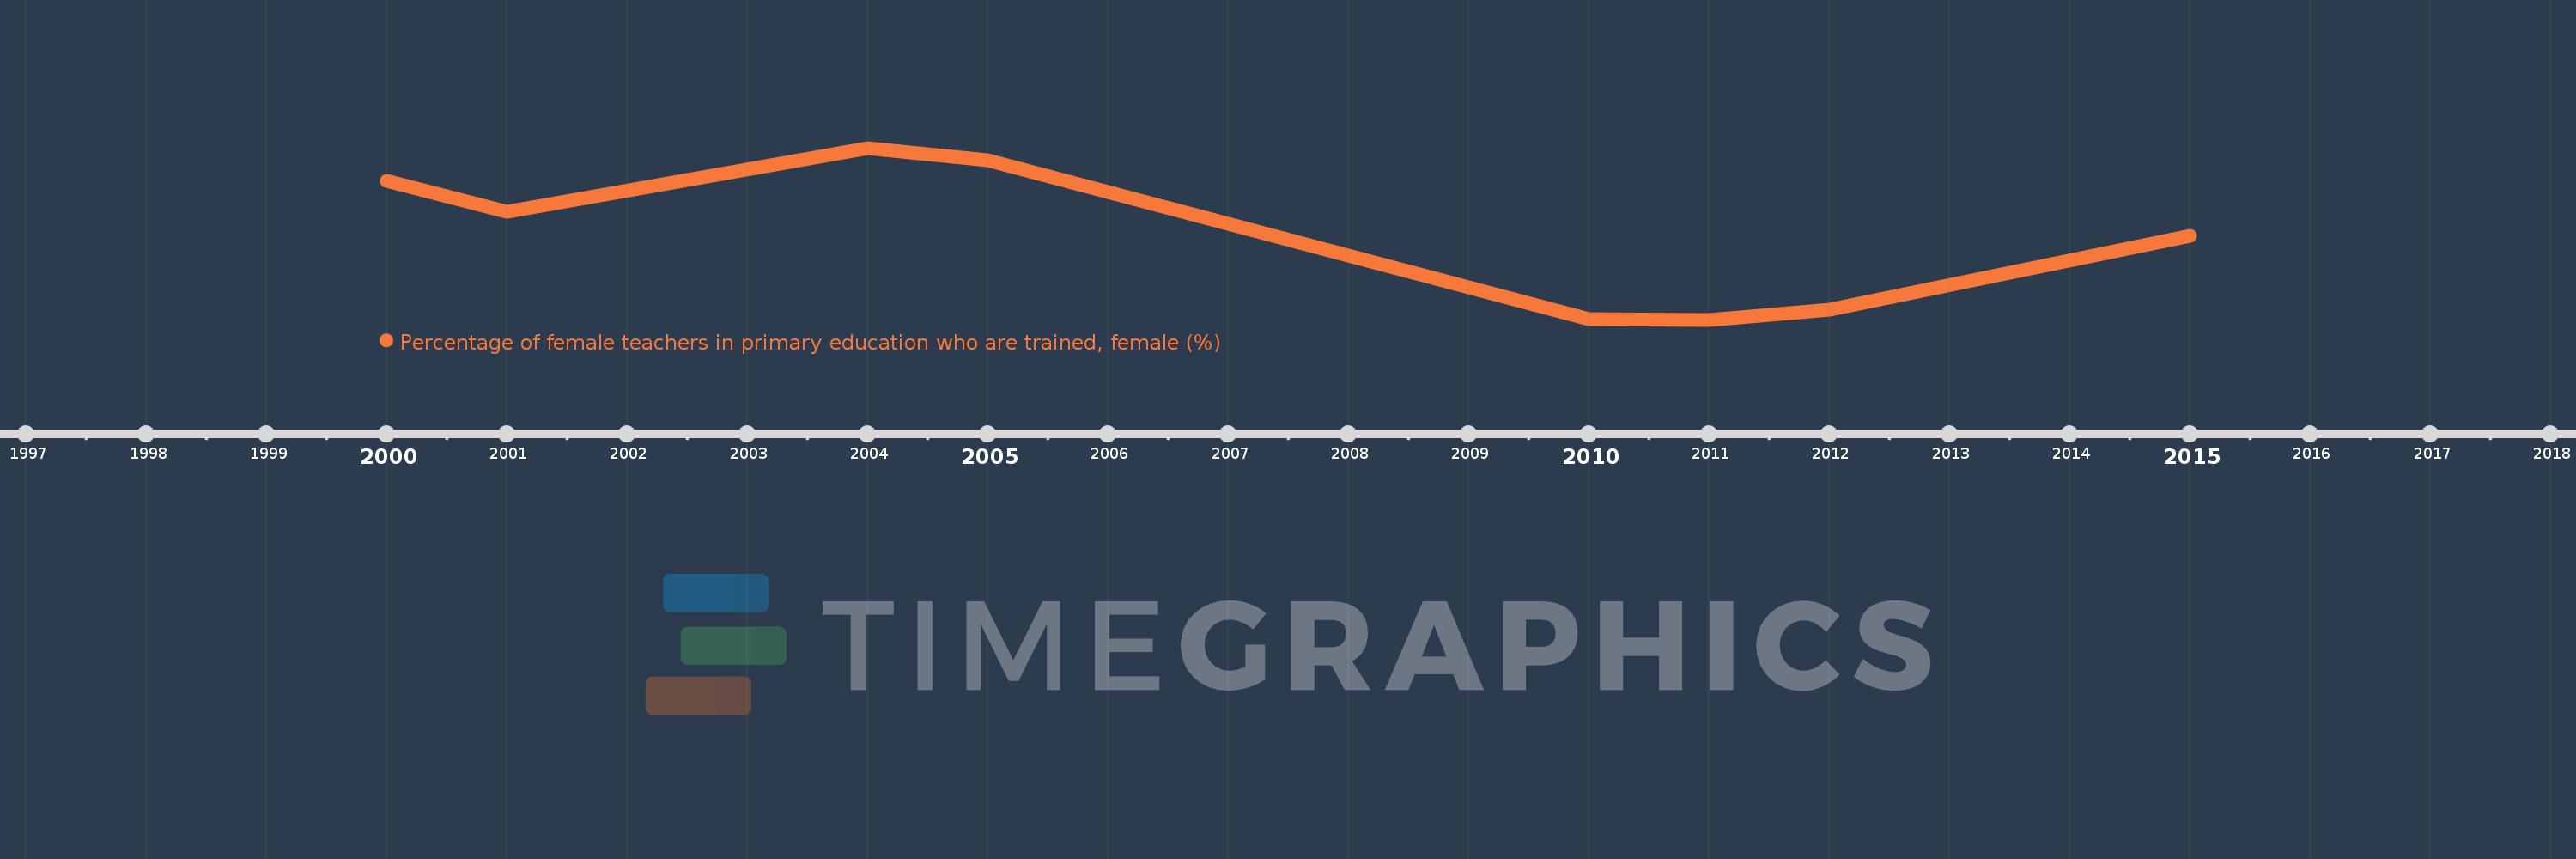
Questa scala temporale mostra un grafico dal 2000 anno al 2015 anno. Benin. I dati fino ad 1999 anno non disponibili. Il numero di osservazioni attuali secondo i date: 8.
La fonte (nome):
Indicatori dello sviluppo mondiale
La fonte (organizzazione):
United Nations Educational, Scientific, and Cultural Organization (UNESCO) Institute for Statistics.
Categorie:
Education, Gender
sono stati aggiornati
23 apr 2017 anni
Indicatori delle variazioni dei valori per anni
In media:
64.452
Minima:
44.736
1 gen 2011 anni
Massimo:
85.013
1 gen 2004 anni
Alla data di osservazione
Valore
Variazione assoluta
La variazione rispetto al valore precedente
1 gen 2000 anni
77.21
+77.21
0.0%
1 gen 2001 anni
69.987
-7.223
-9.35%
1 gen 2004 anni
85.013
+15.026
21.47%
1 gen 2005 anni
82.052
-2.961
-3.48%
1 gen 2010 anni
44.942
-37.11
-45.23%
1 gen 2011 anni
44.736
-0.207
-0.46%
1 gen 2012 anni
47.186
+2.45
5.48%
1 gen 2015 anni
64.493
+17.307
36.68%
Classificazione dei paesi secondo i statistiche attuali per anni