Questa scala temporale mostra un grafico dal 2000 anno al 2010 anno. Trinidad and Tobago. I dati fino ad 1999 anno non disponibili. Il numero di osservazioni attuali secondo i date: 8.
La fonte (nome):
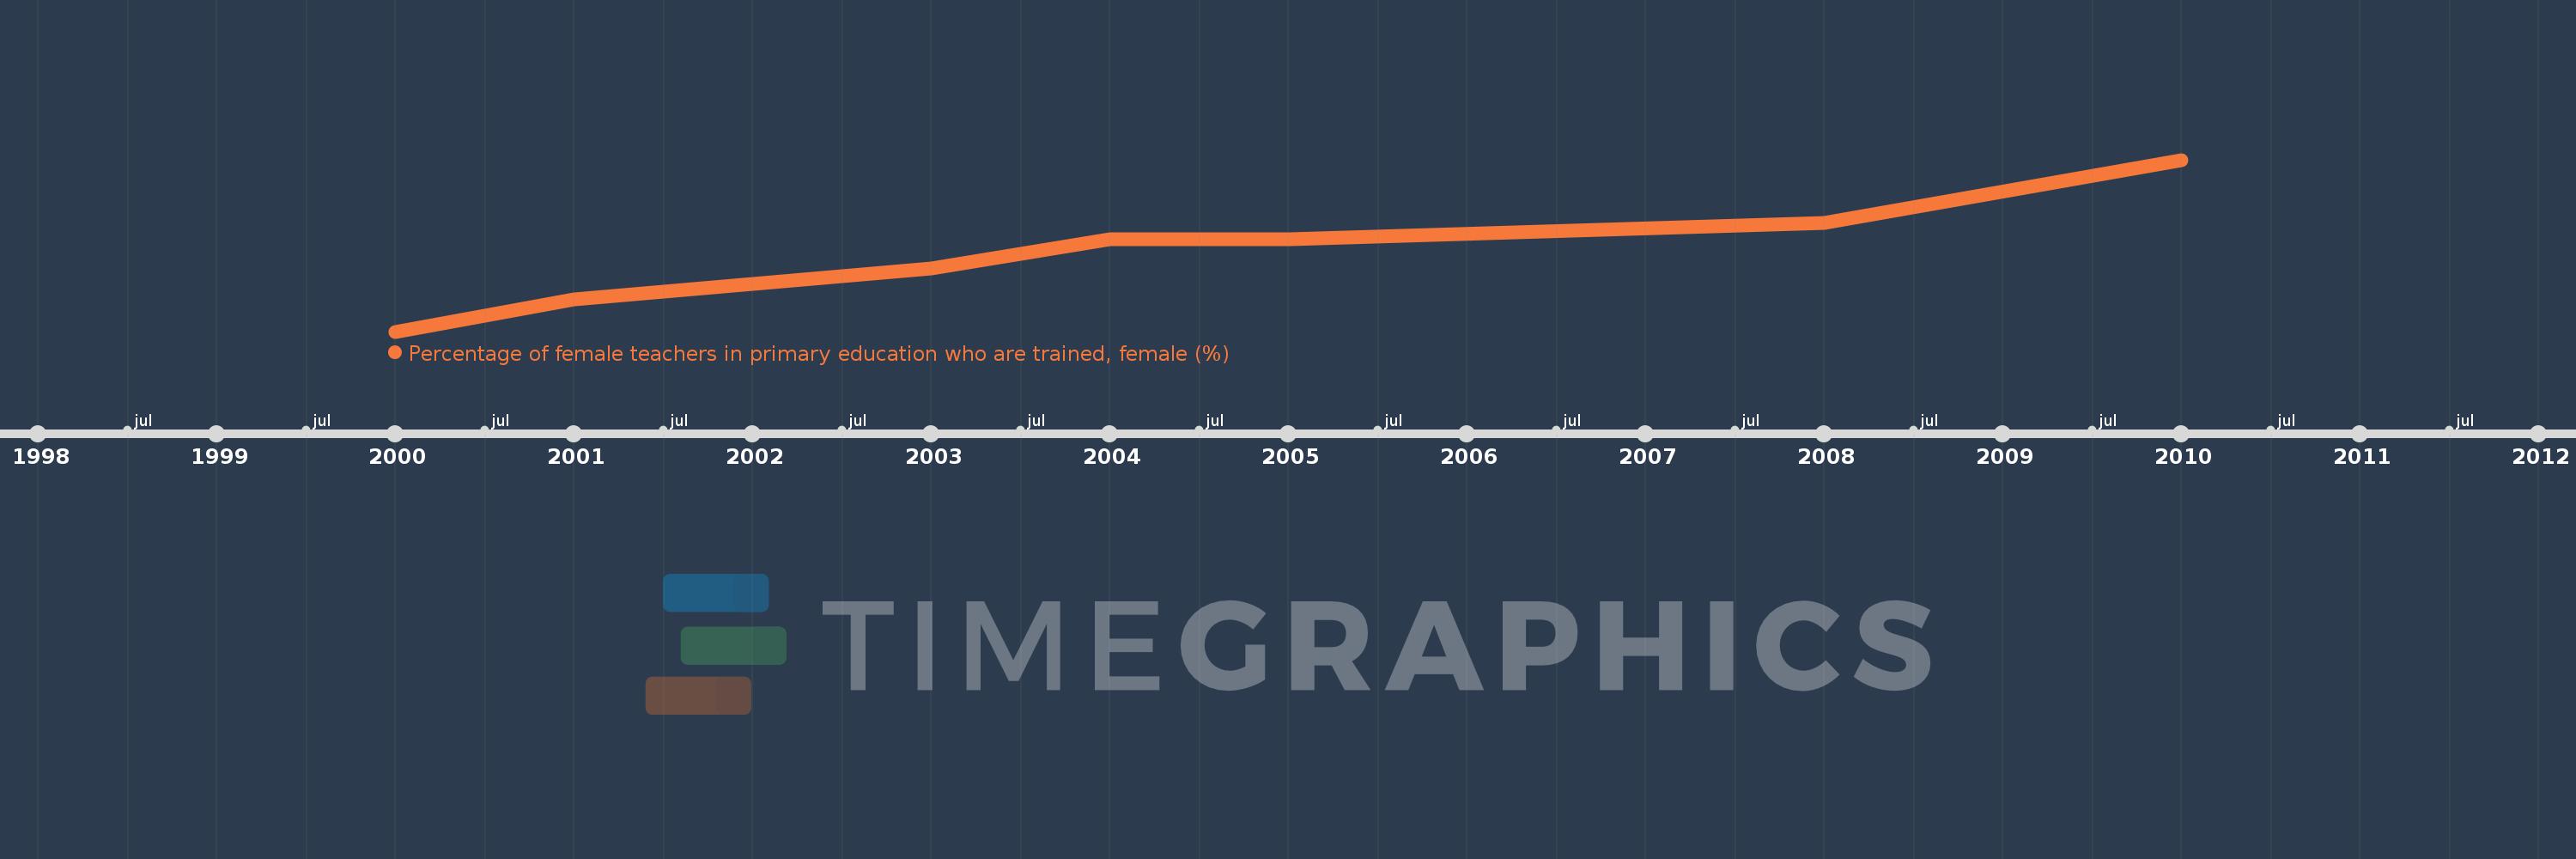
Indicatori dello sviluppo mondiale
La fonte (organizzazione):
United Nations Educational, Scientific, and Cultural Organization (UNESCO) Institute for Statistics.
Categorie:
Education, Gender
sono stati aggiornati
23 apr 2017 anni
Indicatori delle variazioni dei valori per anni
In media:
81.813
Minima:
70.664
1 gen 2000 anni
Massimo:
95.823
1 gen 2010 anni
Alla data di osservazione
Valore
Variazione assoluta
La variazione rispetto al valore precedente
1 gen 2000 anni
70.664
+70.664
0.0%
1 gen 2001 anni
75.402
+4.738
6.71%
1 gen 2002 anni
77.617
+2.214
2.94%
1 gen 2003 anni
79.96
+2.344
3.02%
1 gen 2004 anni
84.215
+4.255
5.32%
1 gen 2005 anni
84.215
0.0
0.0%
1 gen 2008 anni
86.61
+2.395
2.84%
1 gen 2010 anni
95.823
+9.212
10.64%
Classificazione dei paesi secondo i statistiche attuali per anni