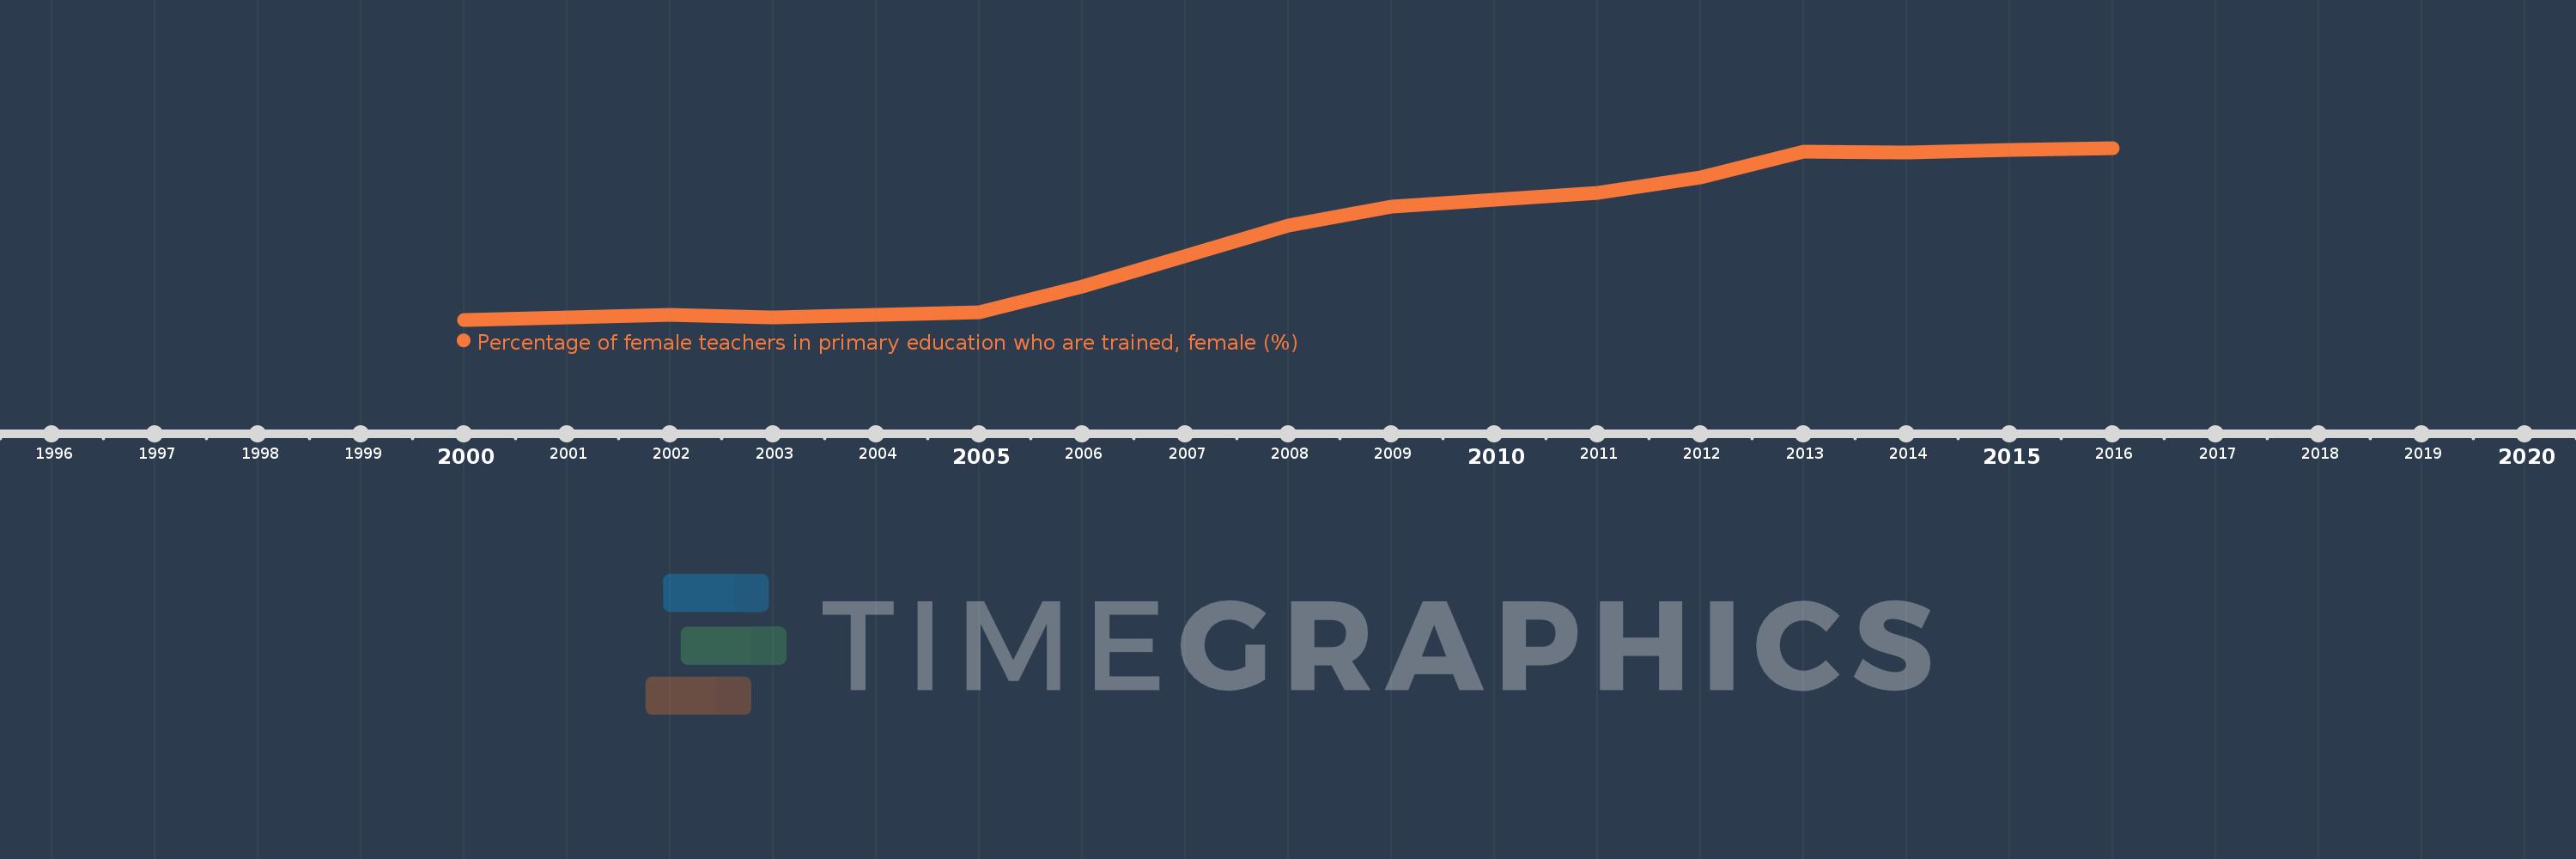
Questa scala temporale mostra un grafico dal 2000 anno al 2016 anno. Nepal. I dati fino ad 1999 anno non disponibili. Il numero di osservazioni attuali secondo i date: 14.
La fonte (nome):
Indicatori dello sviluppo mondiale
La fonte (organizzazione):
United Nations Educational, Scientific, and Cultural Organization (UNESCO) Institute for Statistics.
Categorie:
Education, Gender
sono stati aggiornati
23 apr 2017 anni
Indicatori delle variazioni dei valori per anni
In media:
52.759
Minima:
11.198
1 gen 2000 anni
Massimo:
94.121
1 gen 2016 anni
Alla data di osservazione
Valore
Variazione assoluta
La variazione rispetto al valore precedente
1 gen 2000 anni
11.198
+11.198
0.0%
1 gen 2002 anni
13.573
+2.375
21.21%
1 gen 2003 anni
12.236
-1.336
-9.85%
1 gen 2004 anni
13.493
+1.257
10.27%
1 gen 2005 anni
14.787
+1.293
9.59%
1 gen 2006 anni
27.045
+12.258
82.9%
1 gen 2008 anni
56.846
+29.801
110.19%
1 gen 2009 anni
65.7
+8.854
15.58%
1 gen 2011 anni
72.447
+6.747
10.27%
1 gen 2012 anni
79.851
+7.404
10.22%
1 gen 2013 anni
92.314
+12.463
15.61%
1 gen 2014 anni
91.912
-0.403
-0.44%
1 gen 2015 anni
93.097
+1.185
1.29%
1 gen 2016 anni
94.121
+1.024
1.1%
Classificazione dei paesi secondo i statistiche attuali per anni