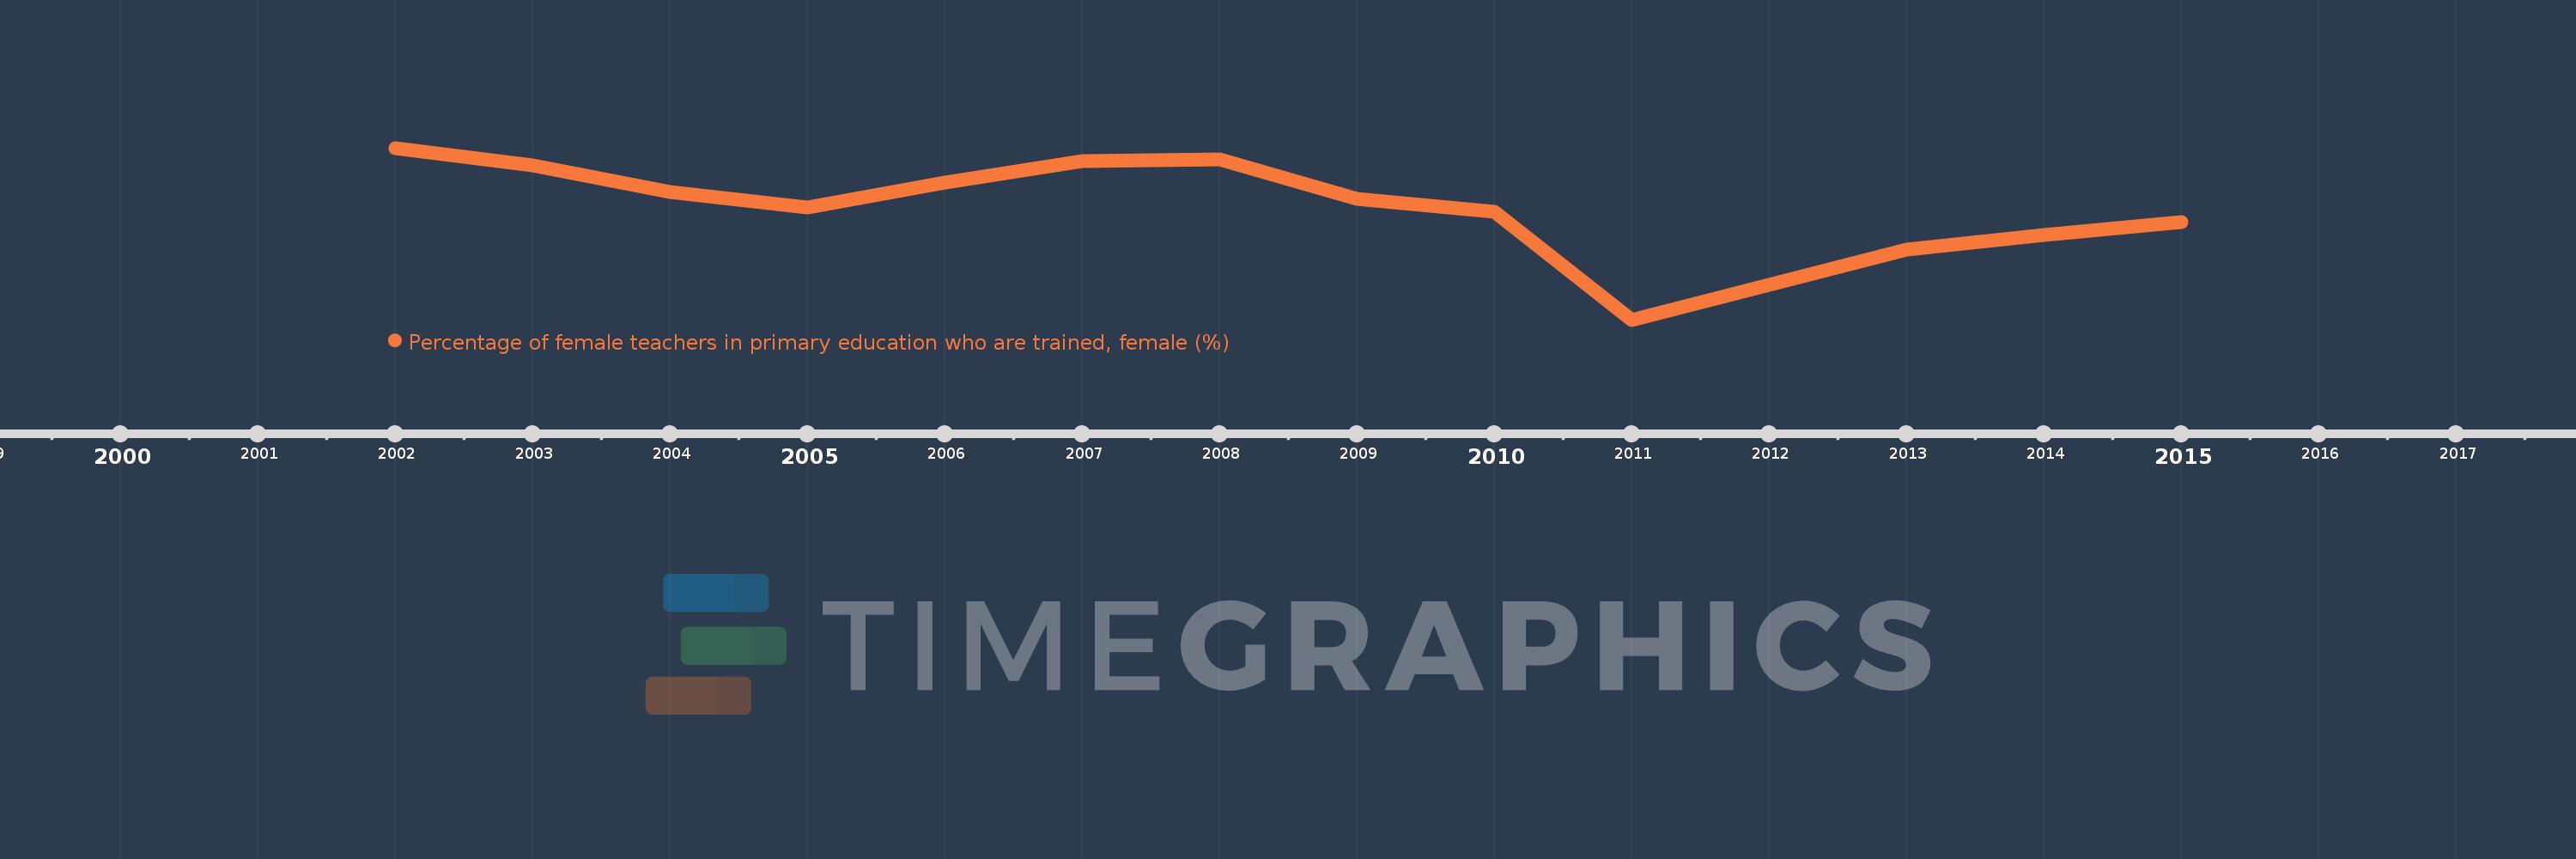
Questa scala temporale mostra un grafico dal 2002 anno al 2015 anno. Low income. I dati fino ad 2001 anno non disponibili. Il numero di osservazioni attuali secondo i date: 14.
La fonte (nome):
Indicatori dello sviluppo mondiale
La fonte (organizzazione):
United Nations Educational, Scientific, and Cultural Organization (UNESCO) Institute for Statistics.
Categorie:
Education, Gender
sono stati aggiornati
23 apr 2017 anni
Indicatori delle variazioni dei valori per anni
In media:
81.714
Minima:
74.896
1 gen 2011 anni
Massimo:
85.562
1 gen 2002 anni
Alla data di osservazione
Valore
Variazione assoluta
La variazione rispetto al valore precedente
1 gen 2002 anni
85.562
+85.562
0.0%
1 gen 2003 anni
84.502
-1.061
-1.24%
1 gen 2004 anni
82.806
-1.696
-2.01%
1 gen 2005 anni
81.857
-0.949
-1.15%
1 gen 2006 anni
83.389
+1.532
1.87%
1 gen 2007 anni
84.764
+1.375
1.65%
1 gen 2008 anni
84.837
+0.073
0.09%
1 gen 2009 anni
82.373
-2.464
-2.9%
1 gen 2010 anni
81.604
-0.768
-0.93%
1 gen 2011 anni
74.896
-6.708
-8.22%
1 gen 2012 anni
77.045
+2.149
2.87%
1 gen 2013 anni
79.26
+2.215
2.87%
1 gen 2014 anni
80.139
+0.88
1.11%
1 gen 2015 anni
80.966
+0.827
1.03%
Classificazione dei paesi secondo i statistiche attuali per anni