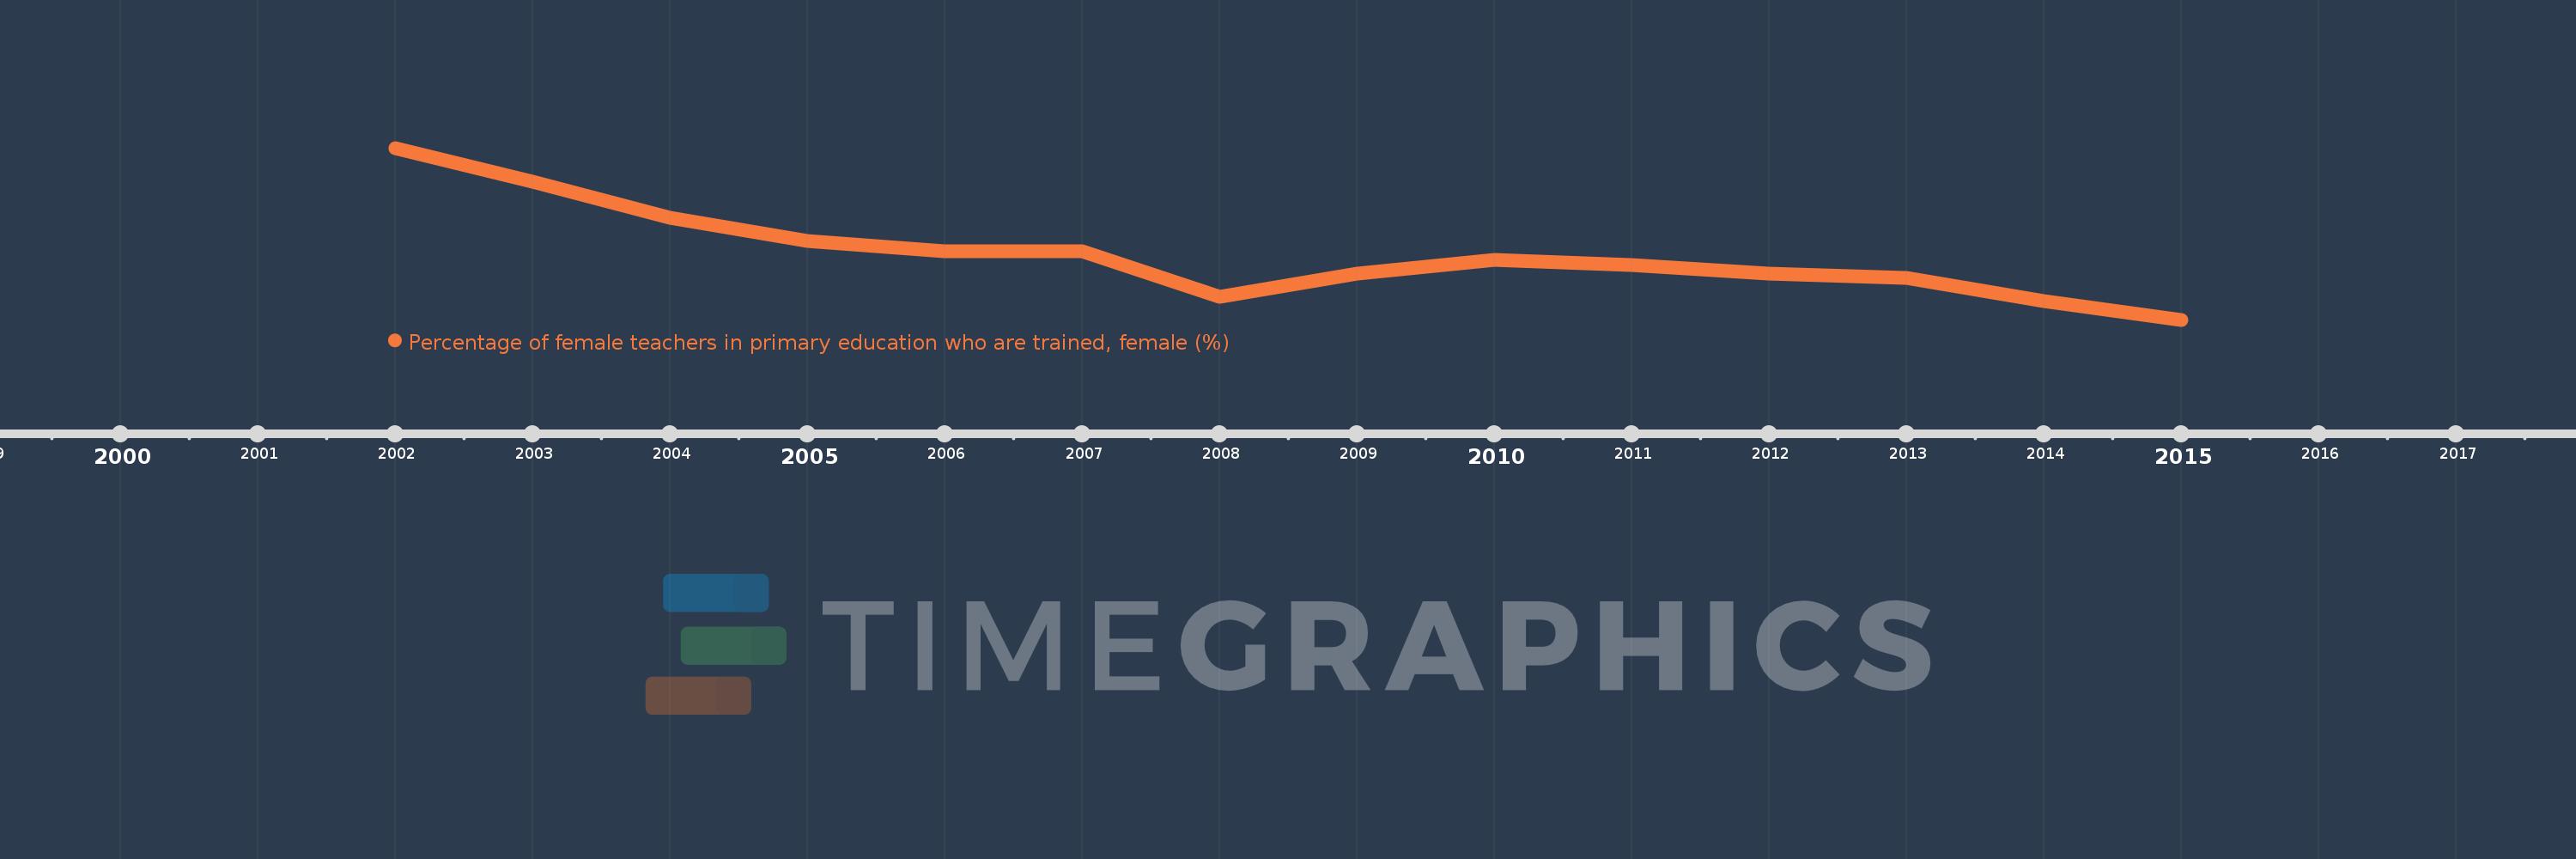
Questa scala temporale mostra un grafico dal 2002 anno al 2015 anno. Pre-demographic dividend. I dati fino ad 2001 anno non disponibili. Il numero di osservazioni attuali secondo i date: 14.
La fonte (nome):
Indicatori dello sviluppo mondiale
La fonte (organizzazione):
United Nations Educational, Scientific, and Cultural Organization (UNESCO) Institute for Statistics.
Categorie:
Education, Gender
sono stati aggiornati
23 apr 2017 anni
Indicatori delle variazioni dei valori per anni
In media:
79.308
Minima:
73.518
1 gen 2015 anni
Massimo:
88.683
1 gen 2002 anni
Alla data di osservazione
Valore
Variazione assoluta
La variazione rispetto al valore precedente
1 gen 2002 anni
88.683
+88.683
0.0%
1 gen 2003 anni
85.718
-2.965
-3.34%
1 gen 2004 anni
82.506
-3.211
-3.75%
1 gen 2005 anni
80.485
-2.021
-2.45%
1 gen 2006 anni
79.588
-0.897
-1.11%
1 gen 2007 anni
79.574
-0.014
-0.02%
1 gen 2008 anni
75.534
-4.041
-5.08%
1 gen 2009 anni
77.578
+2.045
2.71%
1 gen 2010 anni
78.783
+1.205
1.55%
1 gen 2011 anni
78.384
-0.399
-0.51%
1 gen 2012 anni
77.608
-0.775
-0.99%
1 gen 2013 anni
77.178
-0.43
-0.55%
1 gen 2014 anni
75.177
-2.002
-2.59%
1 gen 2015 anni
73.518
-1.659
-2.21%
Classificazione dei paesi secondo i statistiche attuali per anni