Download Queste statistiche in altri paesi:
Linea del tempo:
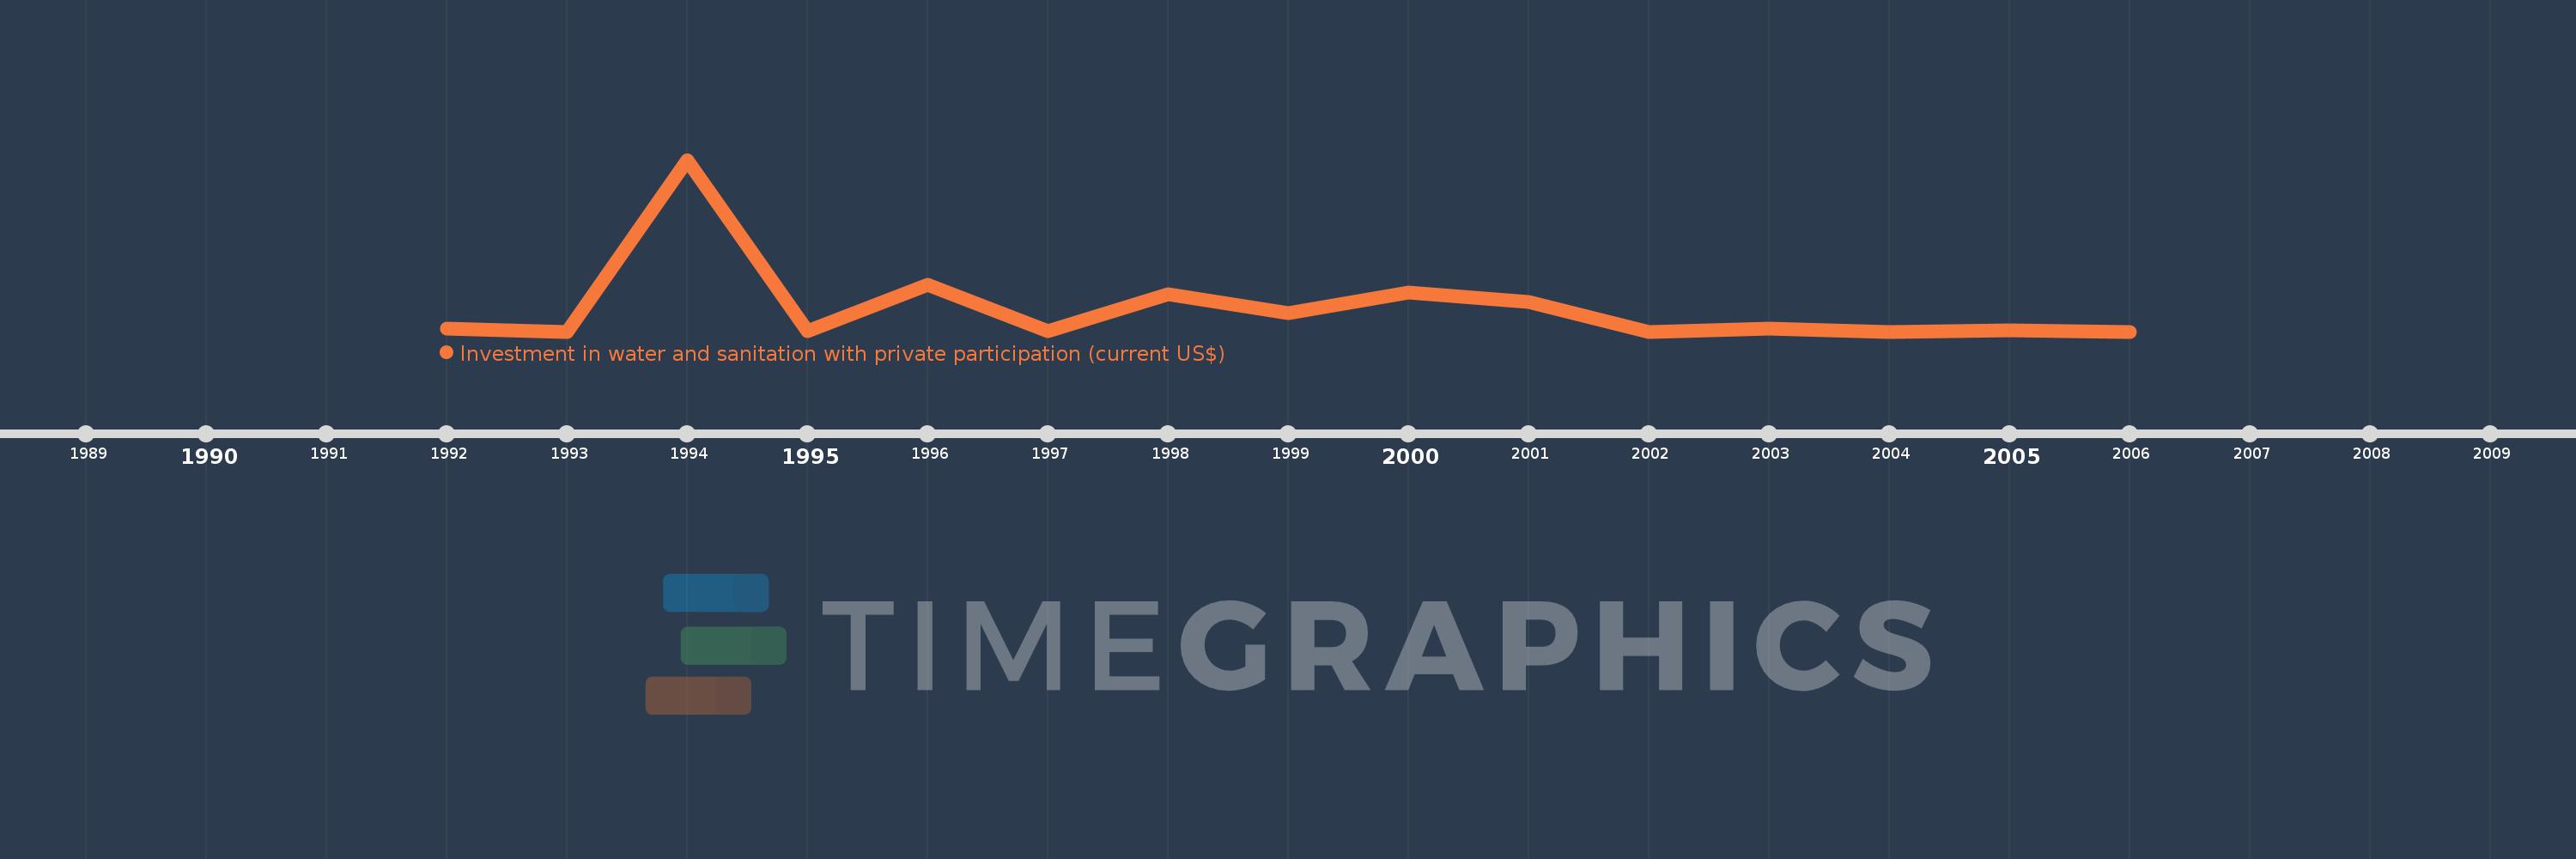
Questa scala temporale mostra un grafico dal 1992 anno al 2006 anno. Argentina. I dati fino ad 1991 anno non disponibili. Il numero di osservazioni attuali secondo i date: 15.
La fonte (nome):
Indicatori dello sviluppo mondiale
La fonte (organizzazione):
World Bank, Private Participation in Infrastructure Project Database (http://ppi.worldbank.org).
Categorie:
Infrastructure, Private Sector
sono stati aggiornati
23 apr 2017 anni
Indicatori delle variazioni dei valori per anni
Minima:
0.0
1 gen 1993 anni
Massimo:
4.0 Mlrd
1 gen 1994 anni
Alla data di osservazione
Valore
Variazione assoluta
La variazione rispetto al valore precedente
1 gen 1992 anni
75.0 Mln
+75.0 Mln
0.0%
1 gen 1993 anni
0.0
-75.0 Mln
-100.0%
1 gen 1994 anni
4.0 Mlrd
+4.0 Mlrd
%
1 gen 1995 anni
1.9 Mln
-3.998 Mlrd
-99.95%
1 gen 1996 anni
1.091 Mlrd
+1.089 Mlrd
57.32 Mille.%
1 gen 1997 anni
900.0 Mille.
-1.09 Mlrd
-99.92%
1 gen 1998 anni
874.0 Mln
+873.1 Mln
97.01 Mille.%
1 gen 1999 anni
438.8 Mln
-435.2 Mln
-49.79%
1 gen 2000 anni
902.4 Mln
+463.6 Mln
105.65%
1 gen 2001 anni
689.9 Mln
-212.5 Mln
-23.55%
1 gen 2002 anni
0.0
-689.9 Mln
-100.0%
1 gen 2003 anni
67.0 Mln
+67.0 Mln
%
1 gen 2004 anni
0.0
-67.0 Mln
-100.0%
1 gen 2005 anni
34.65 Mln
+34.65 Mln
%
1 gen 2006 anni
0.0
-34.65 Mln
-100.0%
Classificazione dei paesi secondo i statistiche attuali per anni