Download Queste statistiche in altri paesi:
Linea del tempo:
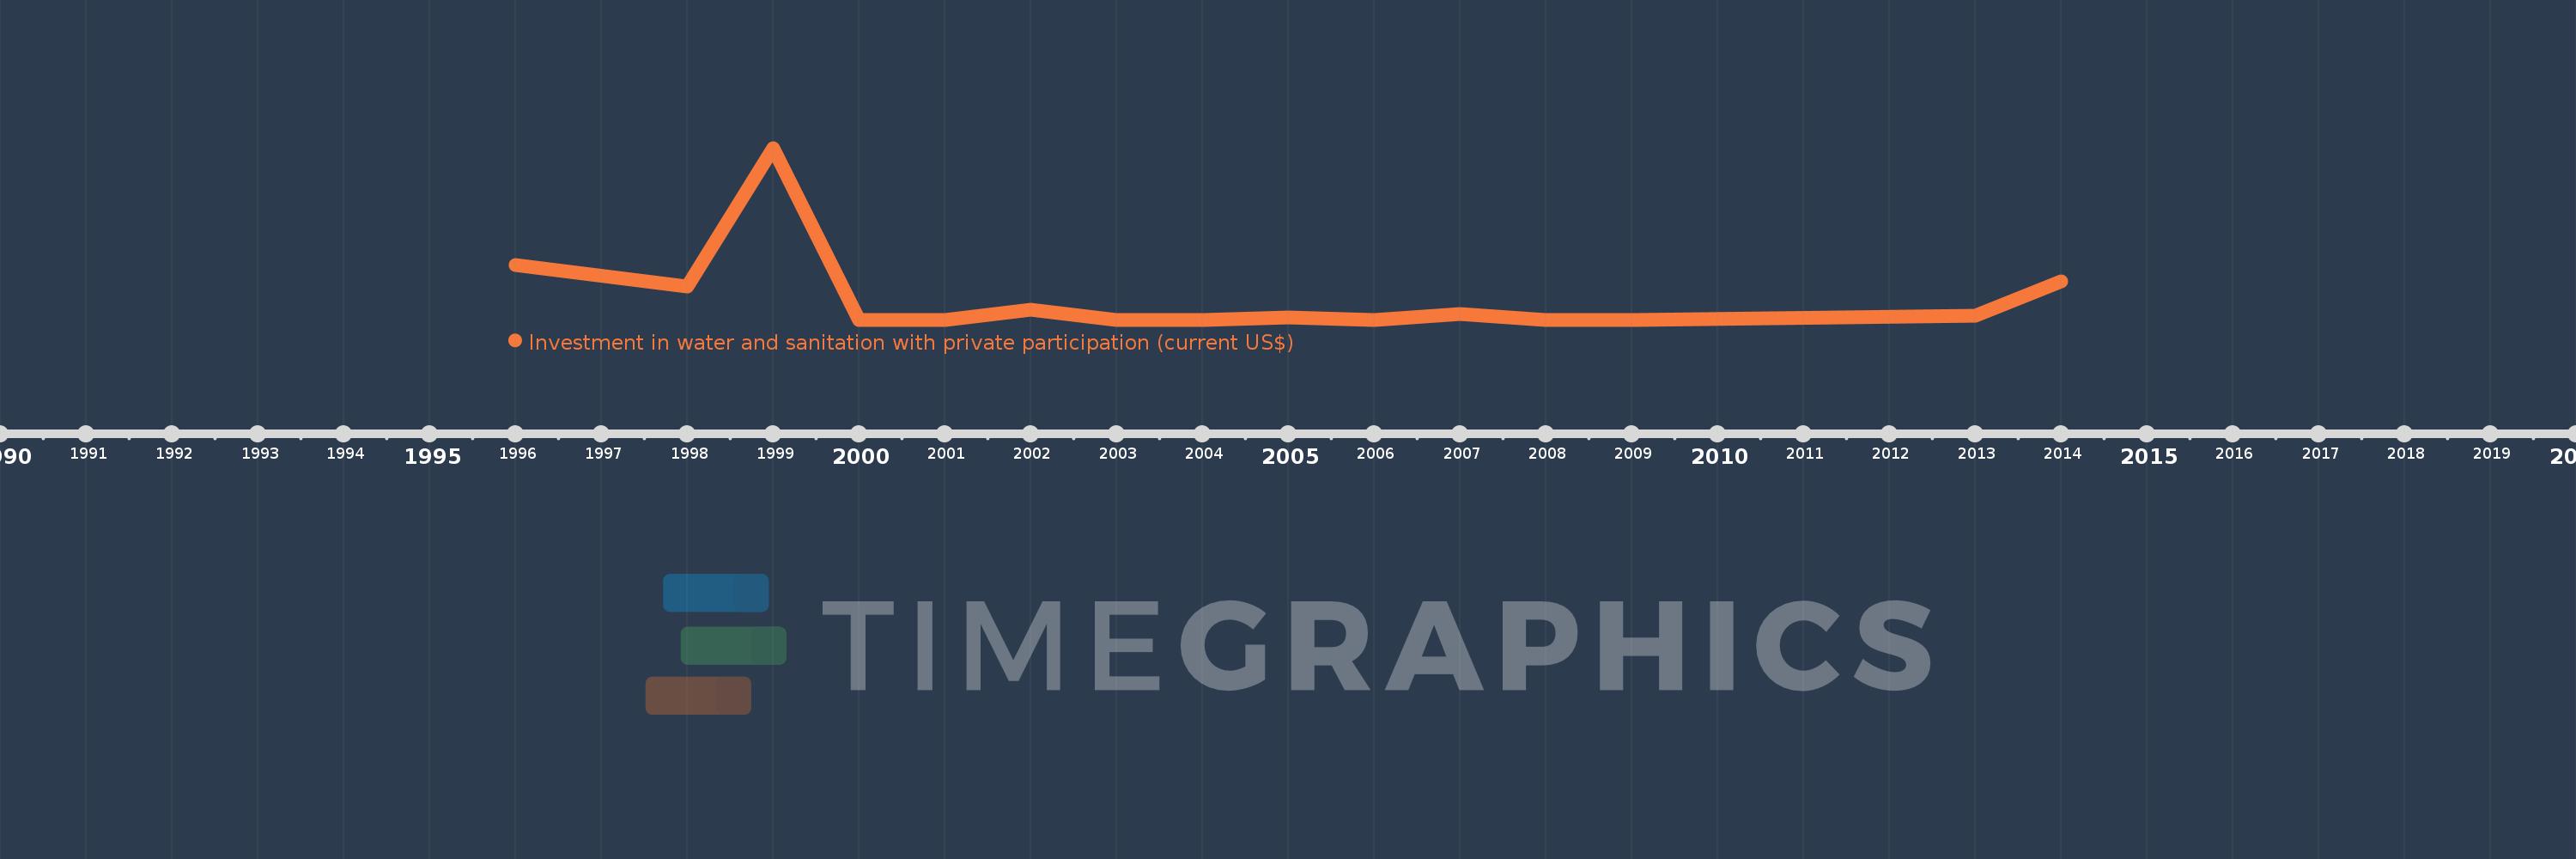
Questa scala temporale mostra un grafico dal 1996 anno al 2014 anno. Indonesia. I dati fino ad 1995 anno non disponibili. Il numero di osservazioni attuali secondo i date: 15.
La fonte (nome):
Indicatori dello sviluppo mondiale
La fonte (organizzazione):
World Bank, Private Participation in Infrastructure Project Database (http://ppi.worldbank.org).
Categorie:
Infrastructure, Private Sector
sono stati aggiornati
23 apr 2017 anni
Indicatori delle variazioni dei valori per anni
Minima:
0.0
1 gen 2000 anni
Massimo:
632.0 Mln
1 gen 1999 anni
Alla data di osservazione
Valore
Variazione assoluta
La variazione rispetto al valore precedente
1 gen 1996 anni
200.0 Mln
+200.0 Mln
0.0%
1 gen 1998 anni
123.2 Mln
-76.8 Mln
-38.4%
1 gen 1999 anni
632.0 Mln
+508.8 Mln
412.99%
1 gen 2000 anni
0.0
-632.0 Mln
-100.0%
1 gen 2002 anni
36.7 Mln
+36.7 Mln
%
1 gen 2003 anni
0.0
-36.7 Mln
-100.0%
1 gen 2005 anni
8.1 Mln
+8.1 Mln
%
1 gen 2006 anni
0.0
-8.1 Mln
-100.0%
1 gen 2007 anni
20.2 Mln
+20.2 Mln
%
1 gen 2008 anni
0.0
-20.2 Mln
-100.0%
1 gen 2013 anni
15.0 Mln
+15.0 Mln
%
1 gen 2014 anni
140.0 Mln
+125.0 Mln
833.33%
Classificazione dei paesi secondo i statistiche attuali per anni