Download Queste statistiche in altri paesi:
Linea del tempo:
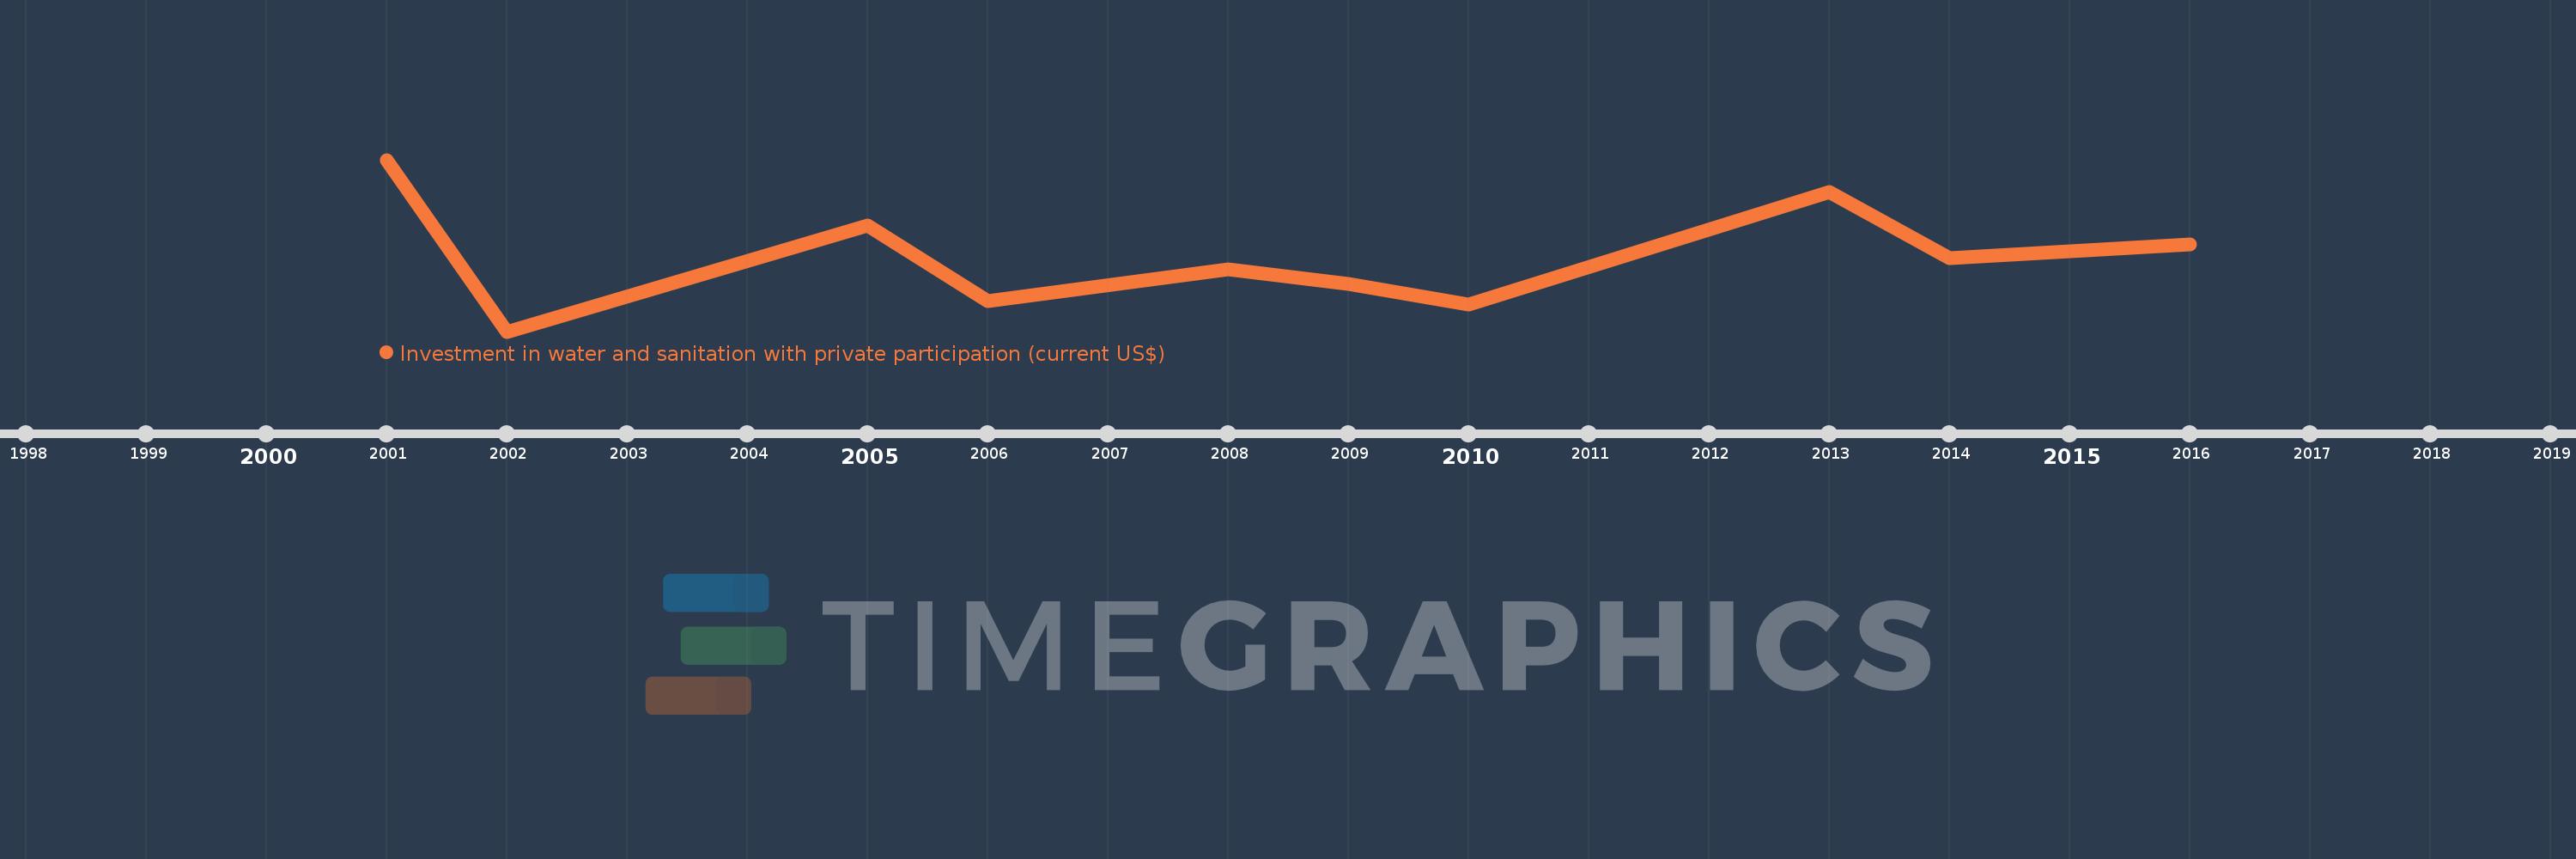
Questa scala temporale mostra un grafico dal 2001 anno al 2016 anno. IBRD only. I dati fino ad 2000 anno non disponibili. Il numero di osservazioni attuali secondo i date: 10.
La fonte (nome):
Indicatori dello sviluppo mondiale
La fonte (organizzazione):
World Bank, Private Participation in Infrastructure Project Database (http://ppi.worldbank.org).
Categorie:
Infrastructure, Private Sector
sono stati aggiornati
23 apr 2017 anni
Indicatori delle variazioni dei valori per anni
Minima:
1.491 Mlrd
1 gen 2002 anni
Massimo:
6.591 Mlrd
1 gen 2001 anni
Alla data di osservazione
Valore
Variazione assoluta
La variazione rispetto al valore precedente
1 gen 2001 anni
6.591 Mlrd
+6.591 Mlrd
0.0%
1 gen 2002 anni
1.491 Mlrd
-5.1 Mlrd
-77.38%
1 gen 2005 anni
4.646 Mlrd
+3.155 Mlrd
211.69%
1 gen 2006 anni
2.391 Mlrd
-2.255 Mlrd
-48.54%
1 gen 2008 anni
3.333 Mlrd
+942.632 Mln
39.43%
1 gen 2009 anni
2.9 Mlrd
-433.782 Mln
-13.01%
1 gen 2010 anni
2.285 Mlrd
-614.654 Mln
-21.2%
1 gen 2013 anni
5.641 Mlrd
+3.356 Mlrd
146.9%
1 gen 2014 anni
3.659 Mlrd
-1.982 Mlrd
-35.14%
1 gen 2016 anni
4.081 Mlrd
+422.05 Mln
11.53%
Classificazione dei paesi secondo i statistiche attuali per anni