Download Queste statistiche in altri paesi:
Linea del tempo:
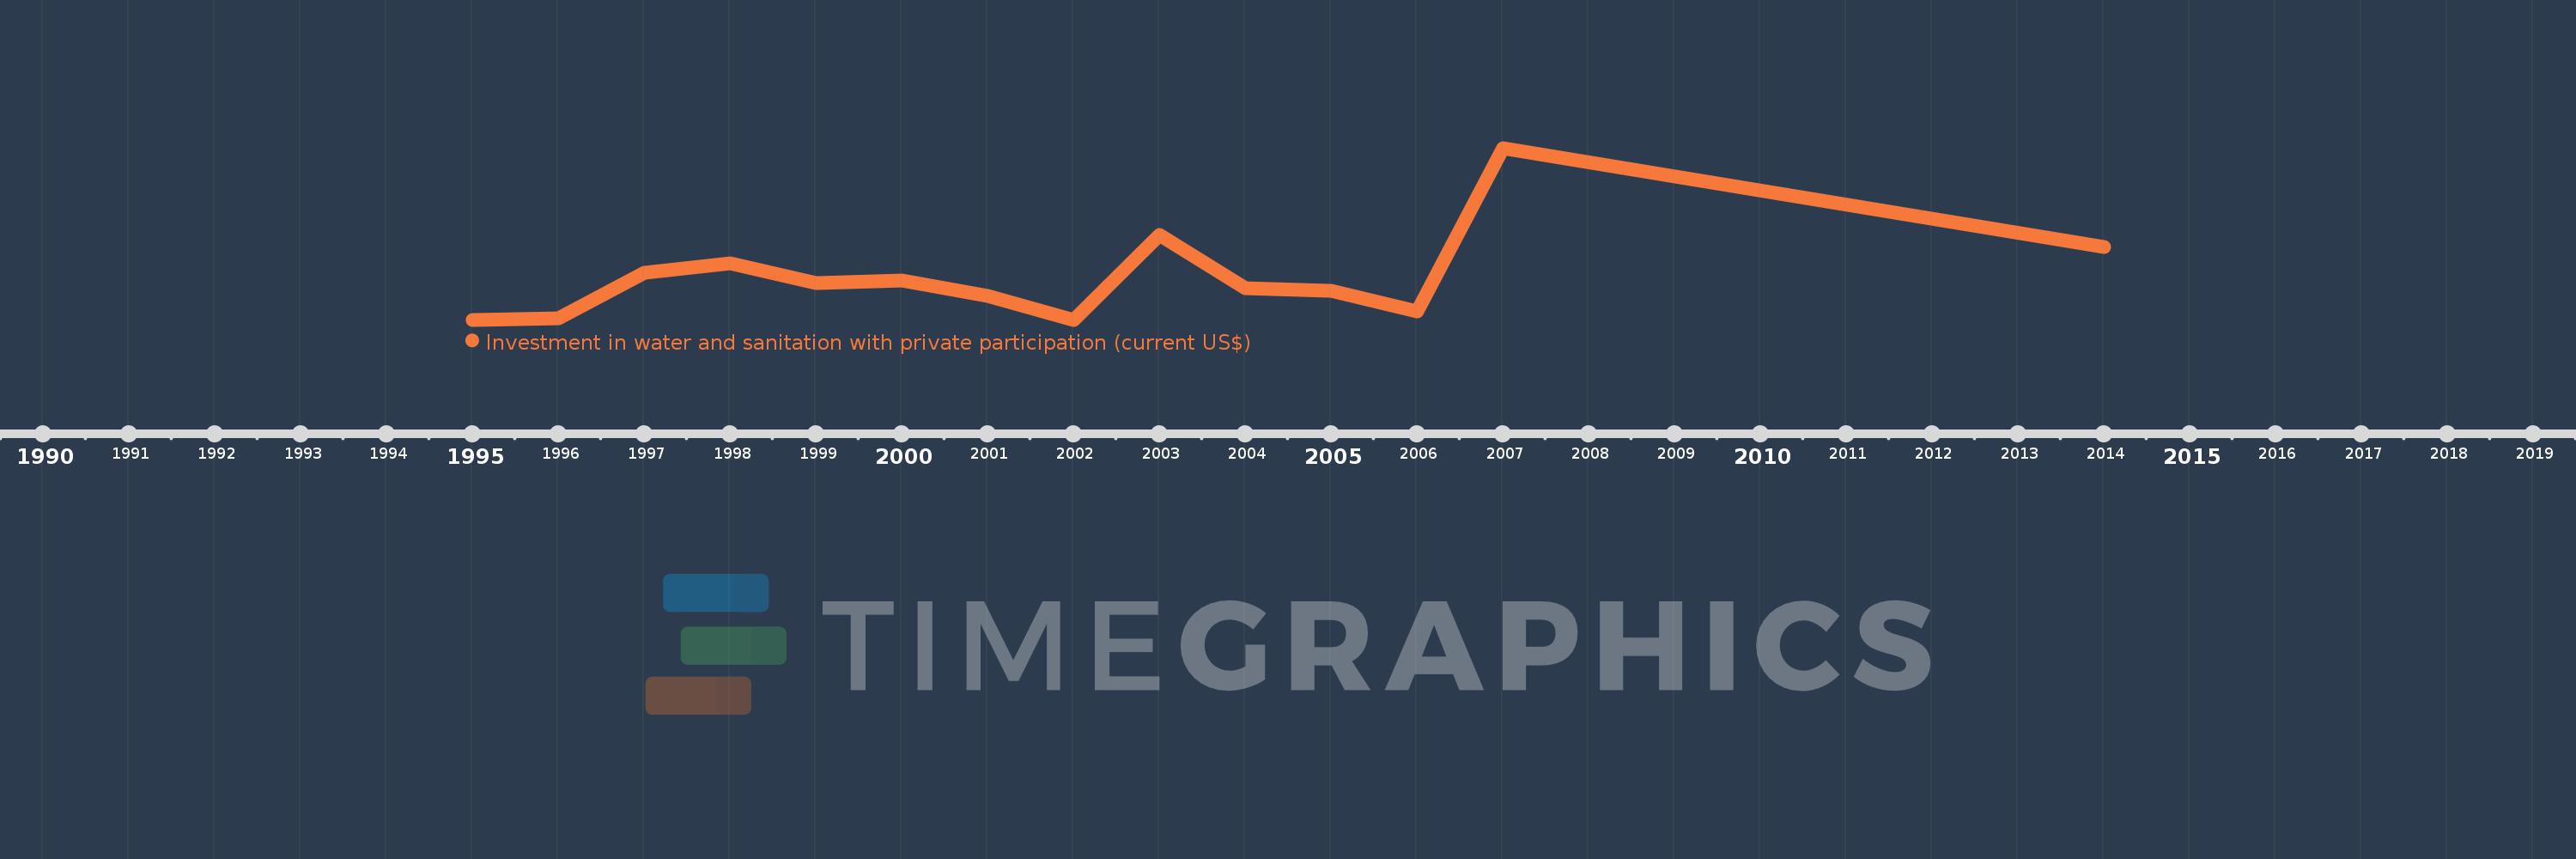
Questa scala temporale mostra un grafico dal 1995 anno al 2014 anno. Colombia. I dati fino ad 1994 anno non disponibili. Il numero di osservazioni attuali secondo i date: 14.
La fonte (nome):
Indicatori dello sviluppo mondiale
La fonte (organizzazione):
World Bank, Private Participation in Infrastructure Project Database (http://ppi.worldbank.org).
Categorie:
Infrastructure, Private Sector
sono stati aggiornati
23 apr 2017 anni
Indicatori delle variazioni dei valori per anni
Minima:
0.0
1 gen 1995 anni
Massimo:
305.0 Mln
1 gen 2007 anni
Alla data di osservazione
Valore
Variazione assoluta
La variazione rispetto al valore precedente
1 gen 1995 anni
0.0
0.0
0.0%
1 gen 1996 anni
3.0 Mln
+3.0 Mln
%
1 gen 1997 anni
83.0 Mln
+80.0 Mln
2.67 Mille.%
1 gen 1998 anni
100.0 Mln
+17.0 Mln
20.48%
1 gen 1999 anni
65.0 Mln
-35.0 Mln
-35.0%
1 gen 2000 anni
70.0 Mln
+5.0 Mln
7.69%
1 gen 2001 anni
42.0 Mln
-28.0 Mln
-40.0%
1 gen 2002 anni
0.0
-42.0 Mln
-100.0%
1 gen 2003 anni
150.7 Mln
+150.7 Mln
%
1 gen 2004 anni
55.3 Mln
-95.4 Mln
-63.3%
1 gen 2005 anni
51.0 Mln
-4.3 Mln
-7.78%
1 gen 2006 anni
15.28 Mln
-35.72 Mln
-70.04%
1 gen 2007 anni
305.0 Mln
+289.72 Mln
1.9 Mille.%
1 gen 2014 anni
129.0 Mln
-176.0 Mln
-57.7%
Classificazione dei paesi secondo i statistiche attuali per anni