Download Queste statistiche in altri paesi:
Linea del tempo:
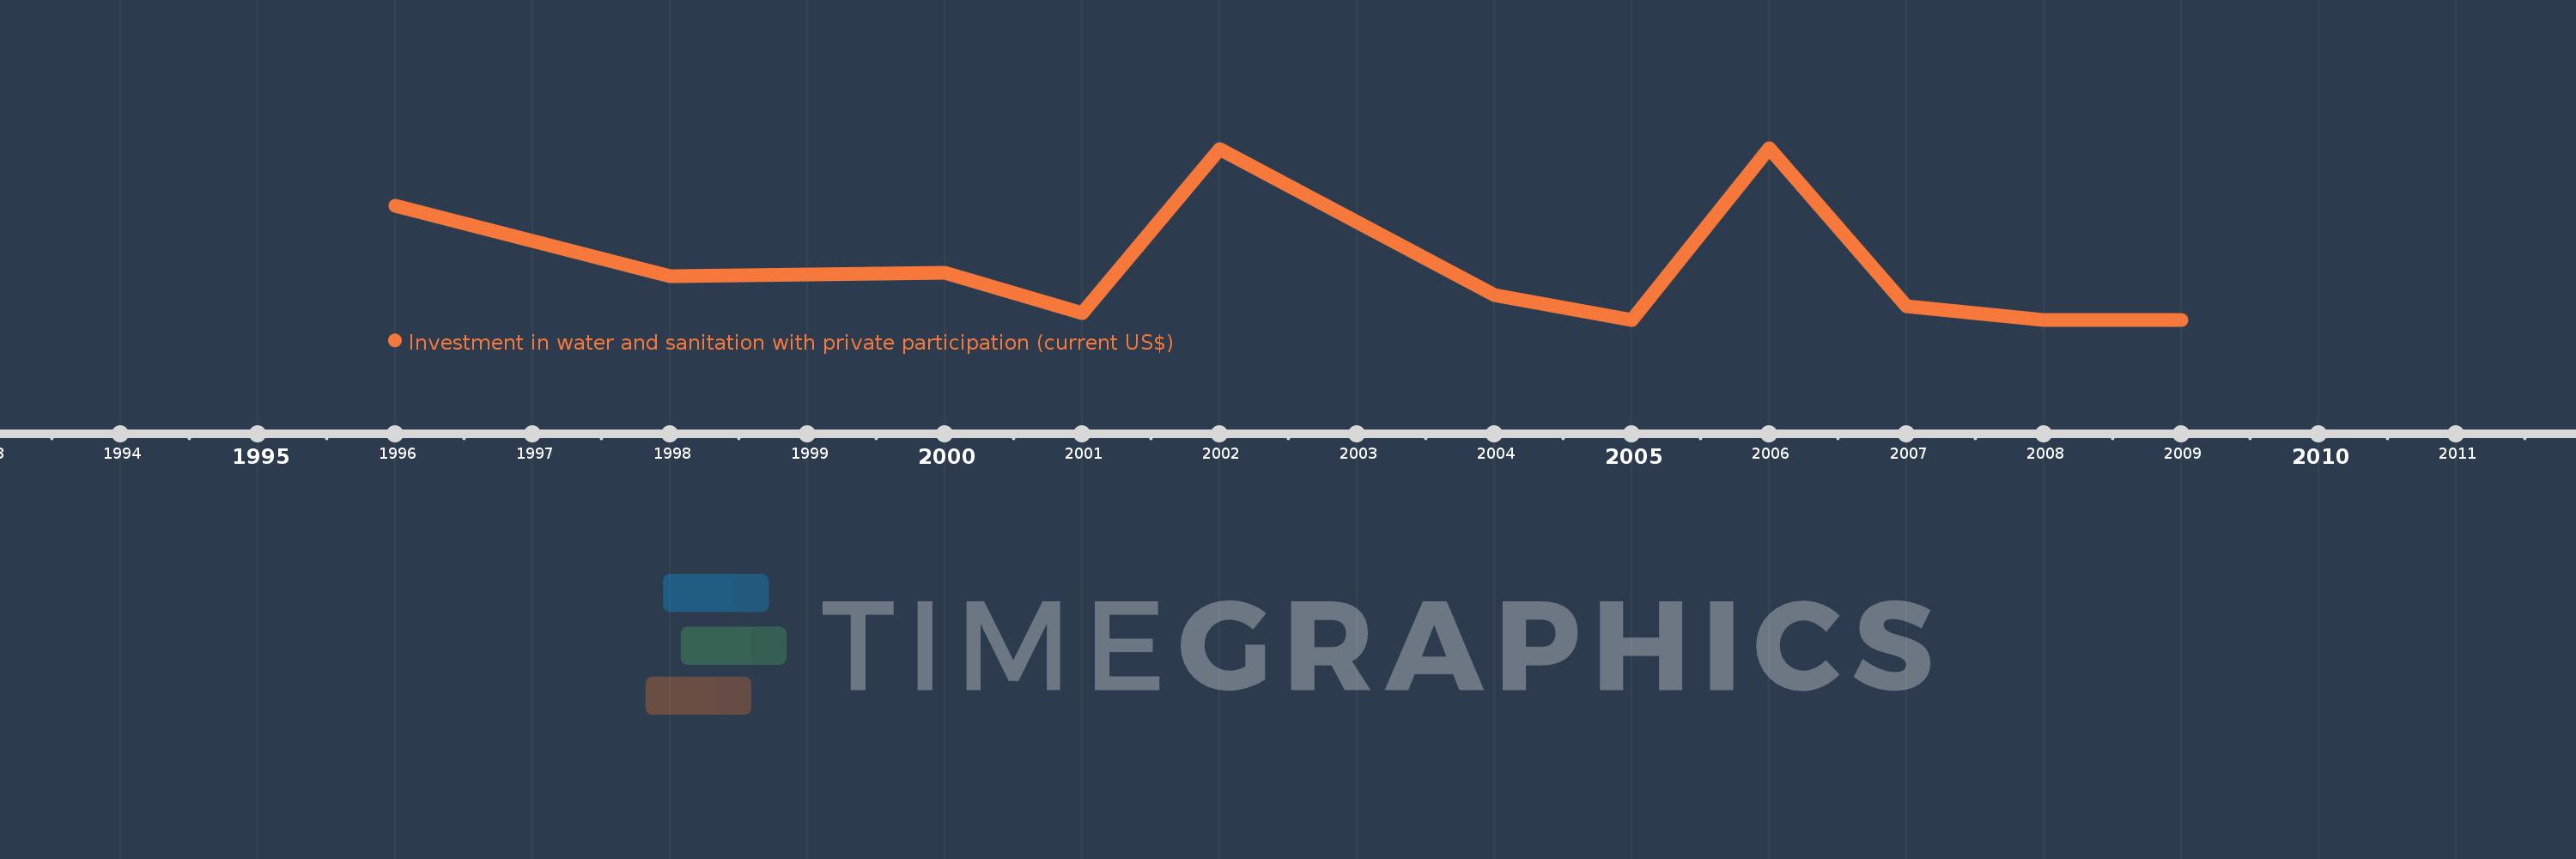
Questa scala temporale mostra un grafico dal 1996 anno al 2009 anno. Thailand. I dati fino ad 1995 anno non disponibili. Il numero di osservazioni attuali secondo i date: 11.
La fonte (nome):
Indicatori dello sviluppo mondiale
La fonte (organizzazione):
World Bank, Private Participation in Infrastructure Project Database (http://ppi.worldbank.org).
Categorie:
Infrastructure, Private Sector
sono stati aggiornati
23 apr 2017 anni
Indicatori delle variazioni dei valori per anni
Minima:
0.0
1 gen 2005 anni
Massimo:
241.6 Mln
1 gen 2006 anni
Alla data di osservazione
Valore
Variazione assoluta
La variazione rispetto al valore precedente
1 gen 1996 anni
160.0 Mln
+160.0 Mln
0.0%
1 gen 1998 anni
61.3 Mln
-98.7 Mln
-61.69%
1 gen 2000 anni
65.7 Mln
+4.4 Mln
7.18%
1 gen 2001 anni
8.8 Mln
-56.9 Mln
-86.61%
1 gen 2002 anni
240.0 Mln
+231.2 Mln
2.63 Mille.%
1 gen 2004 anni
34.3 Mln
-205.7 Mln
-85.71%
1 gen 2005 anni
0.0
-34.3 Mln
-100.0%
1 gen 2006 anni
241.6 Mln
+241.6 Mln
%
1 gen 2007 anni
18.8 Mln
-222.8 Mln
-92.22%
1 gen 2008 anni
0.0
-18.8 Mln
-100.0%
Classificazione dei paesi secondo i statistiche attuali per anni