Download Queste statistiche in altri paesi:
Linea del tempo:
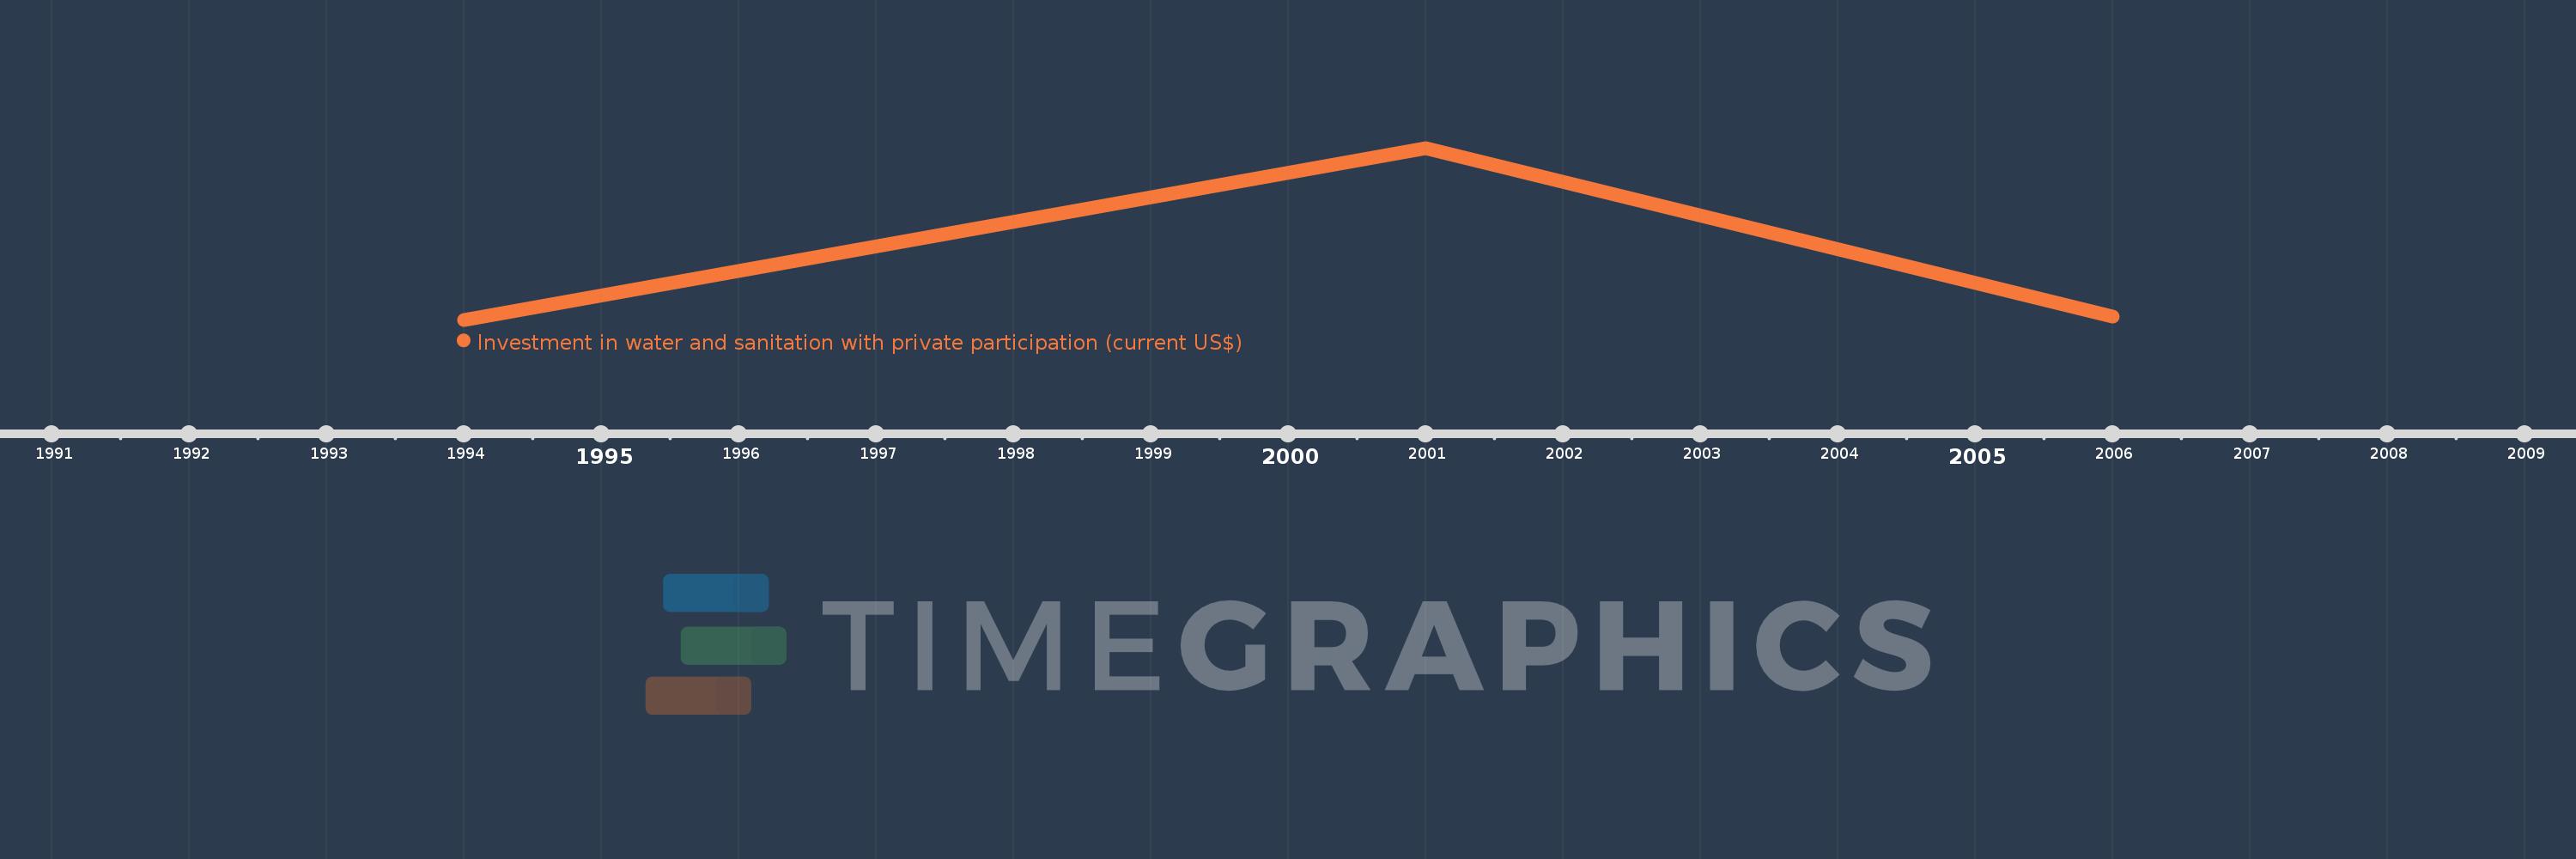
Questa scala temporale mostra un grafico dal 1994 anno al 2006 anno. Uruguay. I dati fino ad 1993 anno non disponibili. Il numero di osservazioni attuali secondo i date: 3.
La fonte (nome):
Indicatori dello sviluppo mondiale
La fonte (organizzazione):
World Bank, Private Participation in Infrastructure Project Database (http://ppi.worldbank.org).
Categorie:
Infrastructure, Private Sector
sono stati aggiornati
23 apr 2017 anni
Indicatori delle variazioni dei valori per anni
Minima:
10.0 Mln
1 gen 1994 anni
Massimo:
351.0 Mln
1 gen 2001 anni
Alla data di osservazione
Valore
Variazione assoluta
La variazione rispetto al valore precedente
1 gen 1994 anni
10.0 Mln
+10.0 Mln
0.0%
1 gen 2001 anni
351.0 Mln
+341.0 Mln
3.41 Mille.%
1 gen 2006 anni
17.0 Mln
-334.0 Mln
-95.16%
Classificazione dei paesi secondo i statistiche attuali per anni