Download Queste statistiche in altri paesi:
Linea del tempo:
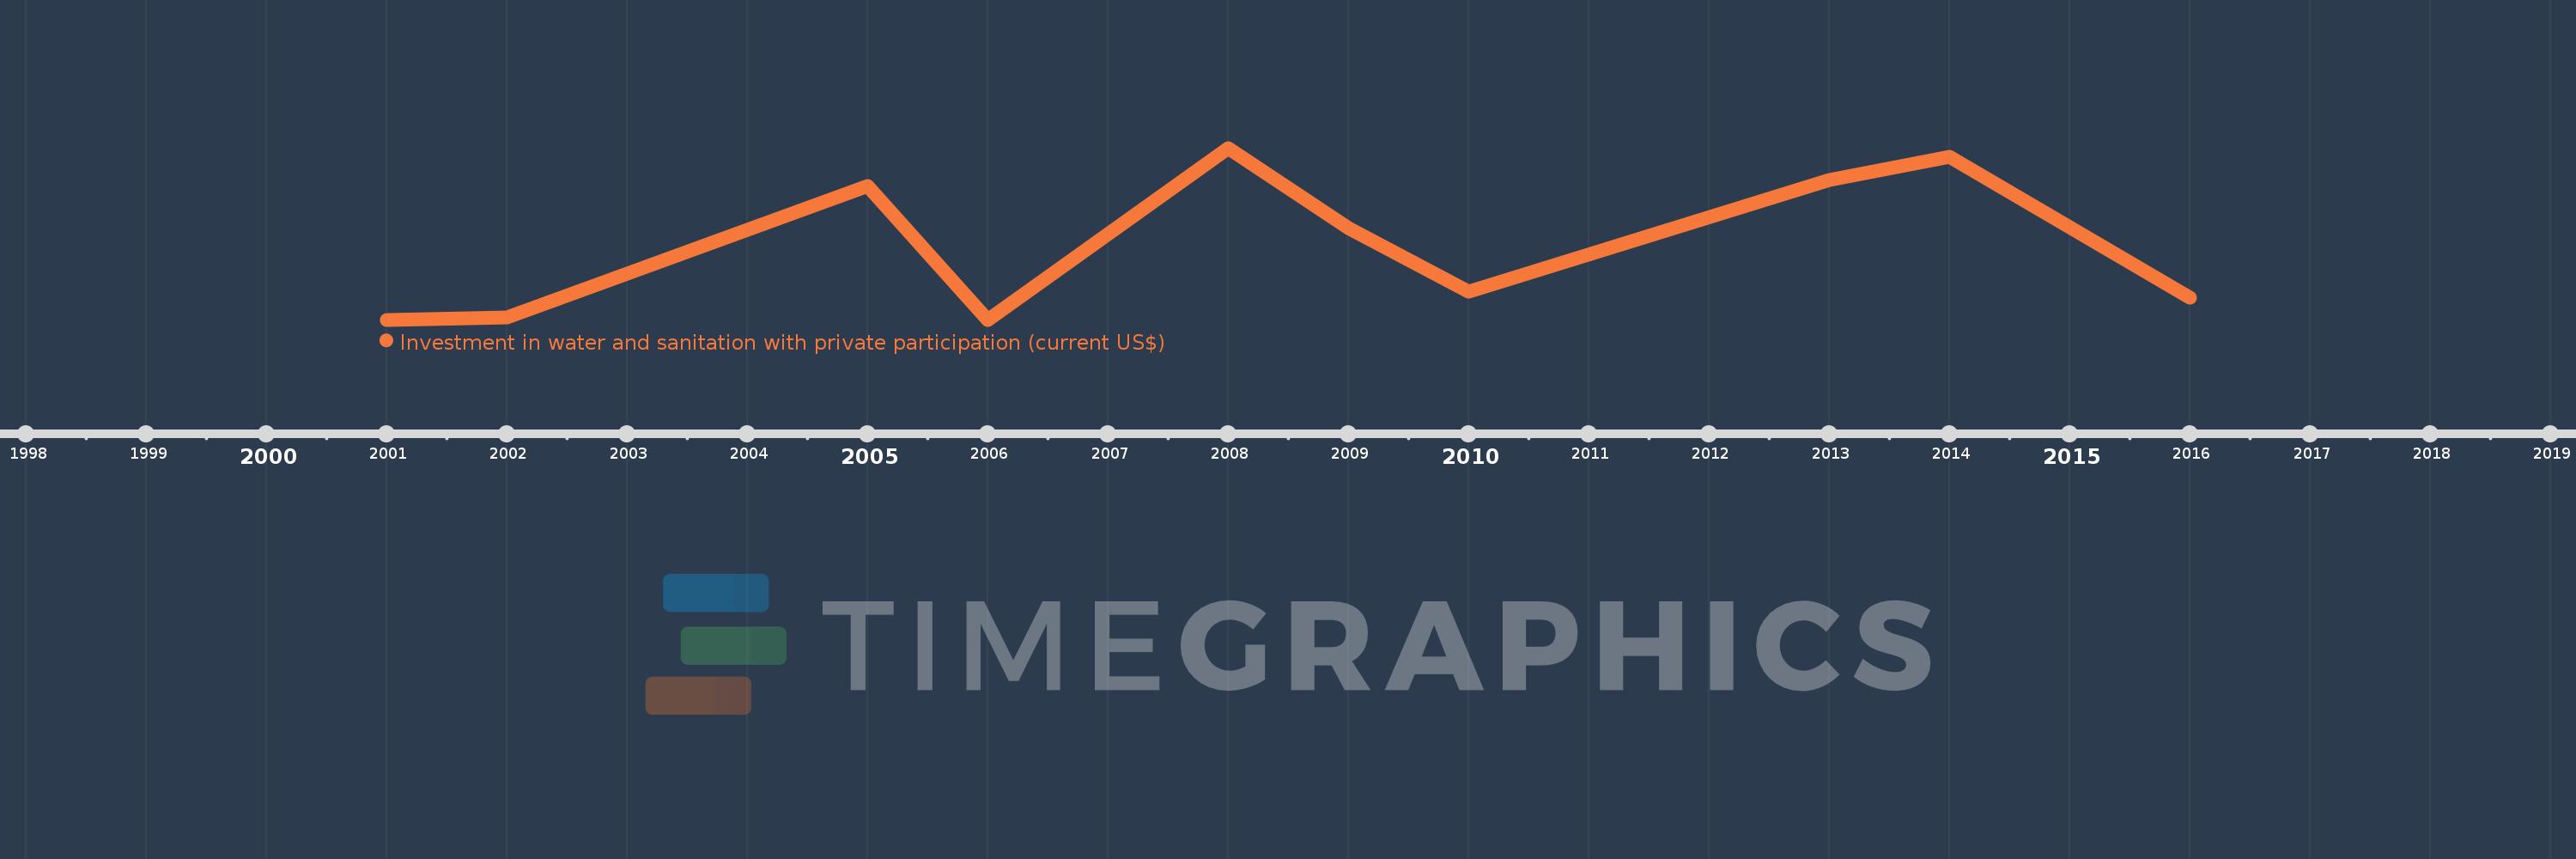
Questa scala temporale mostra un grafico dal 2001 anno al 2016 anno. India. I dati fino ad 2000 anno non disponibili. Il numero di osservazioni attuali secondo i date: 10.
La fonte (nome):
Indicatori dello sviluppo mondiale
La fonte (organizzazione):
World Bank, Private Participation in Infrastructure Project Database (http://ppi.worldbank.org).
Categorie:
Infrastructure, Private Sector
sono stati aggiornati
23 apr 2017 anni
Indicatori delle variazioni dei valori per anni
Minima:
0.0
1 gen 2001 anni
Massimo:
142.25 Mln
1 gen 2008 anni
Alla data di osservazione
Valore
Variazione assoluta
La variazione rispetto al valore precedente
1 gen 2001 anni
0.0
0.0
0.0%
1 gen 2002 anni
2.1 Mln
+2.1 Mln
%
1 gen 2005 anni
110.75 Mln
+108.65 Mln
5.17 Mille.%
1 gen 2006 anni
0.0
-110.75 Mln
-100.0%
1 gen 2008 anni
142.25 Mln
+142.25 Mln
%
1 gen 2009 anni
75.9 Mln
-66.35 Mln
-46.64%
1 gen 2010 anni
23.53 Mln
-52.37 Mln
-69.0%
1 gen 2013 anni
115.6 Mln
+92.07 Mln
391.29%
1 gen 2014 anni
135.1 Mln
+19.5 Mln
16.87%
1 gen 2016 anni
18.5 Mln
-116.6 Mln
-86.31%
Classificazione dei paesi secondo i statistiche attuali per anni