Download Queste statistiche in altri paesi:
Linea del tempo:
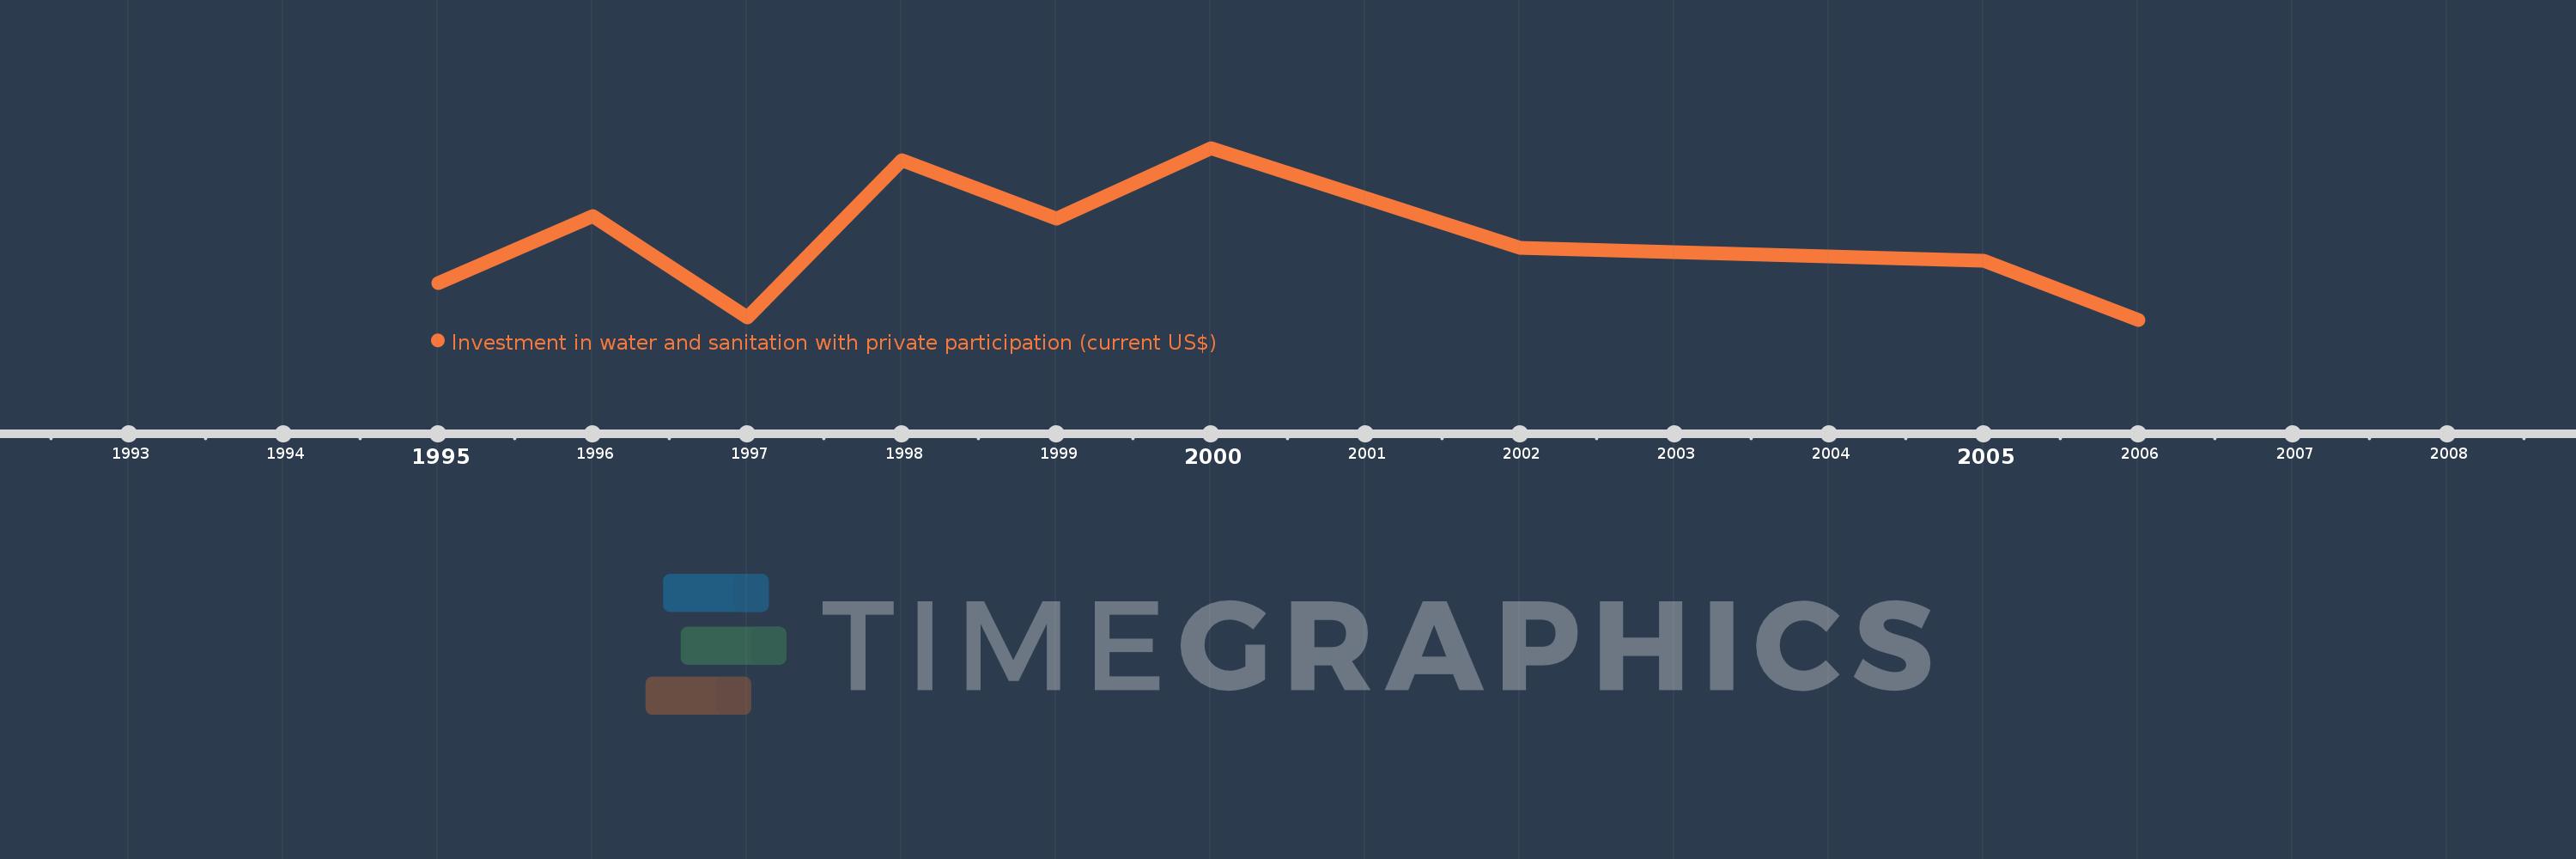
Questa scala temporale mostra un grafico dal 1995 anno al 2006 anno. Latin America & Caribbean (excluding high income). I dati fino ad 1994 anno non disponibili. Il numero di osservazioni attuali secondo i date: 9.
La fonte (nome):
Indicatori dello sviluppo mondiale
La fonte (organizzazione):
World Bank, Private Participation in Infrastructure Project Database (http://ppi.worldbank.org).
Categorie:
Infrastructure, Private Sector
sono stati aggiornati
23 apr 2017 anni
Indicatori delle variazioni dei valori per anni
Minima:
120.444 Mln
1 gen 2006 anni
Massimo:
2.007 Mlrd
1 gen 2000 anni
Alla data di osservazione
Valore
Variazione assoluta
La variazione rispetto al valore precedente
1 gen 1995 anni
525.2 Mln
+525.2 Mln
0.0%
1 gen 1996 anni
1.264 Mlrd
+738.6 Mln
140.63%
1 gen 1997 anni
147.9 Mln
-1.116 Mlrd
-88.3%
1 gen 1998 anni
1.869 Mlrd
+1.721 Mlrd
1.16 Mille.%
1 gen 1999 anni
1.227 Mlrd
-642.3 Mln
-34.36%
1 gen 2000 anni
2.007 Mlrd
+780.4 Mln
63.61%
1 gen 2002 anni
906.43 Mln
-1.101 Mlrd
-54.84%
1 gen 2005 anni
772.68 Mln
-133.75 Mln
-14.76%
1 gen 2006 anni
120.444 Mln
-652.236 Mln
-84.41%
Classificazione dei paesi secondo i statistiche attuali per anni