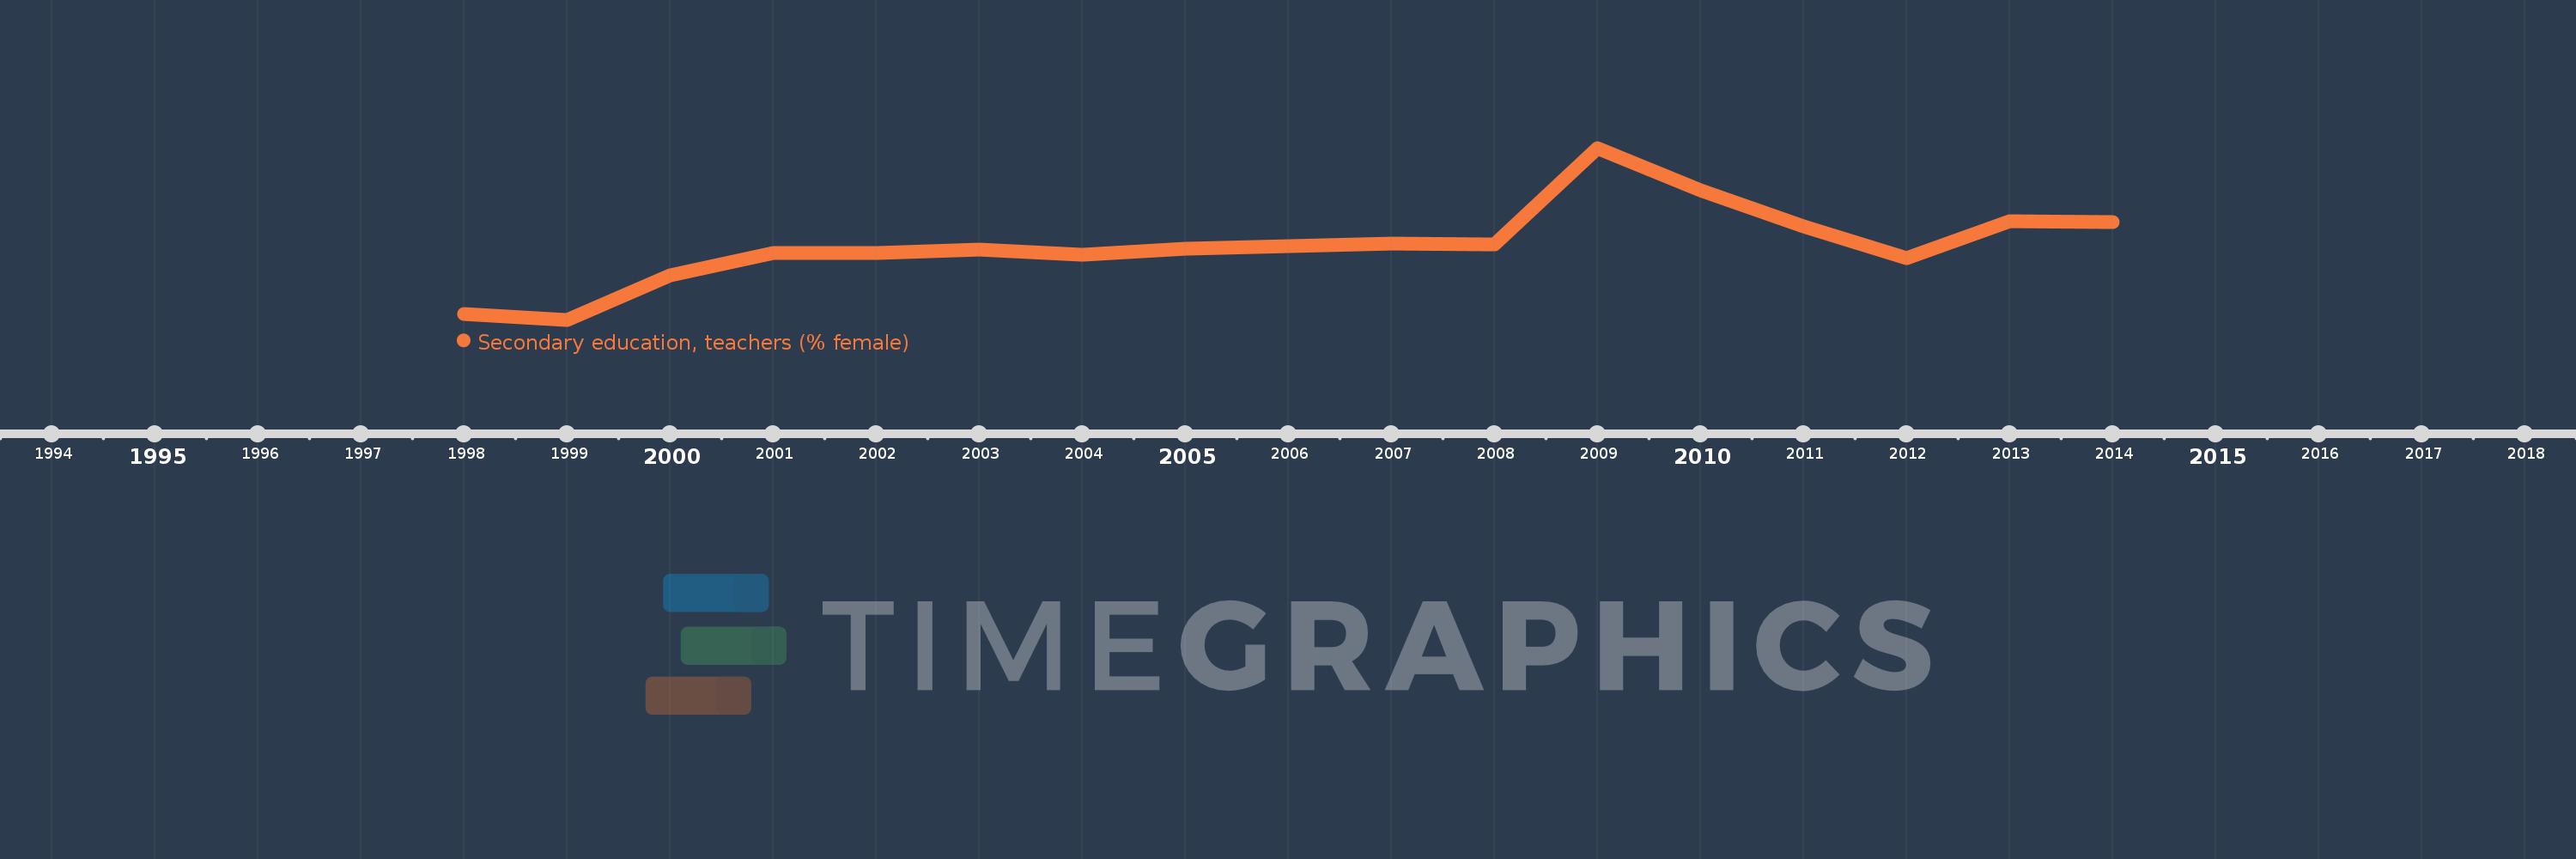
Questa scala temporale mostra un grafico dal 1998 anno al 2014 anno. Pacific island small states. I dati fino ad 1997 anno non disponibili. Il numero di osservazioni attuali secondo i date: 17.
La fonte (nome):
Indicatori dello sviluppo mondiale
La fonte (organizzazione):
United Nations Educational, Scientific, and Cultural Organization (UNESCO) Institute for Statistics.
Categorie:
Education, Gender
sono stati aggiornati
23 apr 2017 anni
Indicatori delle variazioni dei valori per anni
In media:
48.852
Minima:
41.656
1 gen 1999 anni
Massimo:
58.222
1 gen 2009 anni
Alla data di osservazione
Valore
Variazione assoluta
La variazione rispetto al valore precedente
1 gen 1998 anni
42.245
+42.245
0.0%
1 gen 1999 anni
41.656
-0.589
-1.39%
1 gen 2000 anni
45.956
+4.3
10.32%
1 gen 2001 anni
48.082
+2.126
4.63%
1 gen 2002 anni
48.121
+0.04
0.08%
1 gen 2003 anni
48.414
+0.293
0.61%
1 gen 2004 anni
47.947
-0.467
-0.96%
1 gen 2005 anni
48.484
+0.537
1.12%
1 gen 2006 anni
48.735
+0.252
0.52%
1 gen 2007 anni
49.037
+0.301
0.62%
1 gen 2008 anni
48.92
-0.117
-0.24%
1 gen 2009 anni
58.222
+9.302
19.02%
1 gen 2010 anni
54.158
-4.065
-6.98%
1 gen 2011 anni
50.685
-3.473
-6.41%
1 gen 2012 anni
47.596
-3.089
-6.09%
1 gen 2013 anni
51.141
+3.545
7.45%
1 gen 2014 anni
51.085
-0.056
-0.11%
Classificazione dei paesi secondo i statistiche attuali per anni