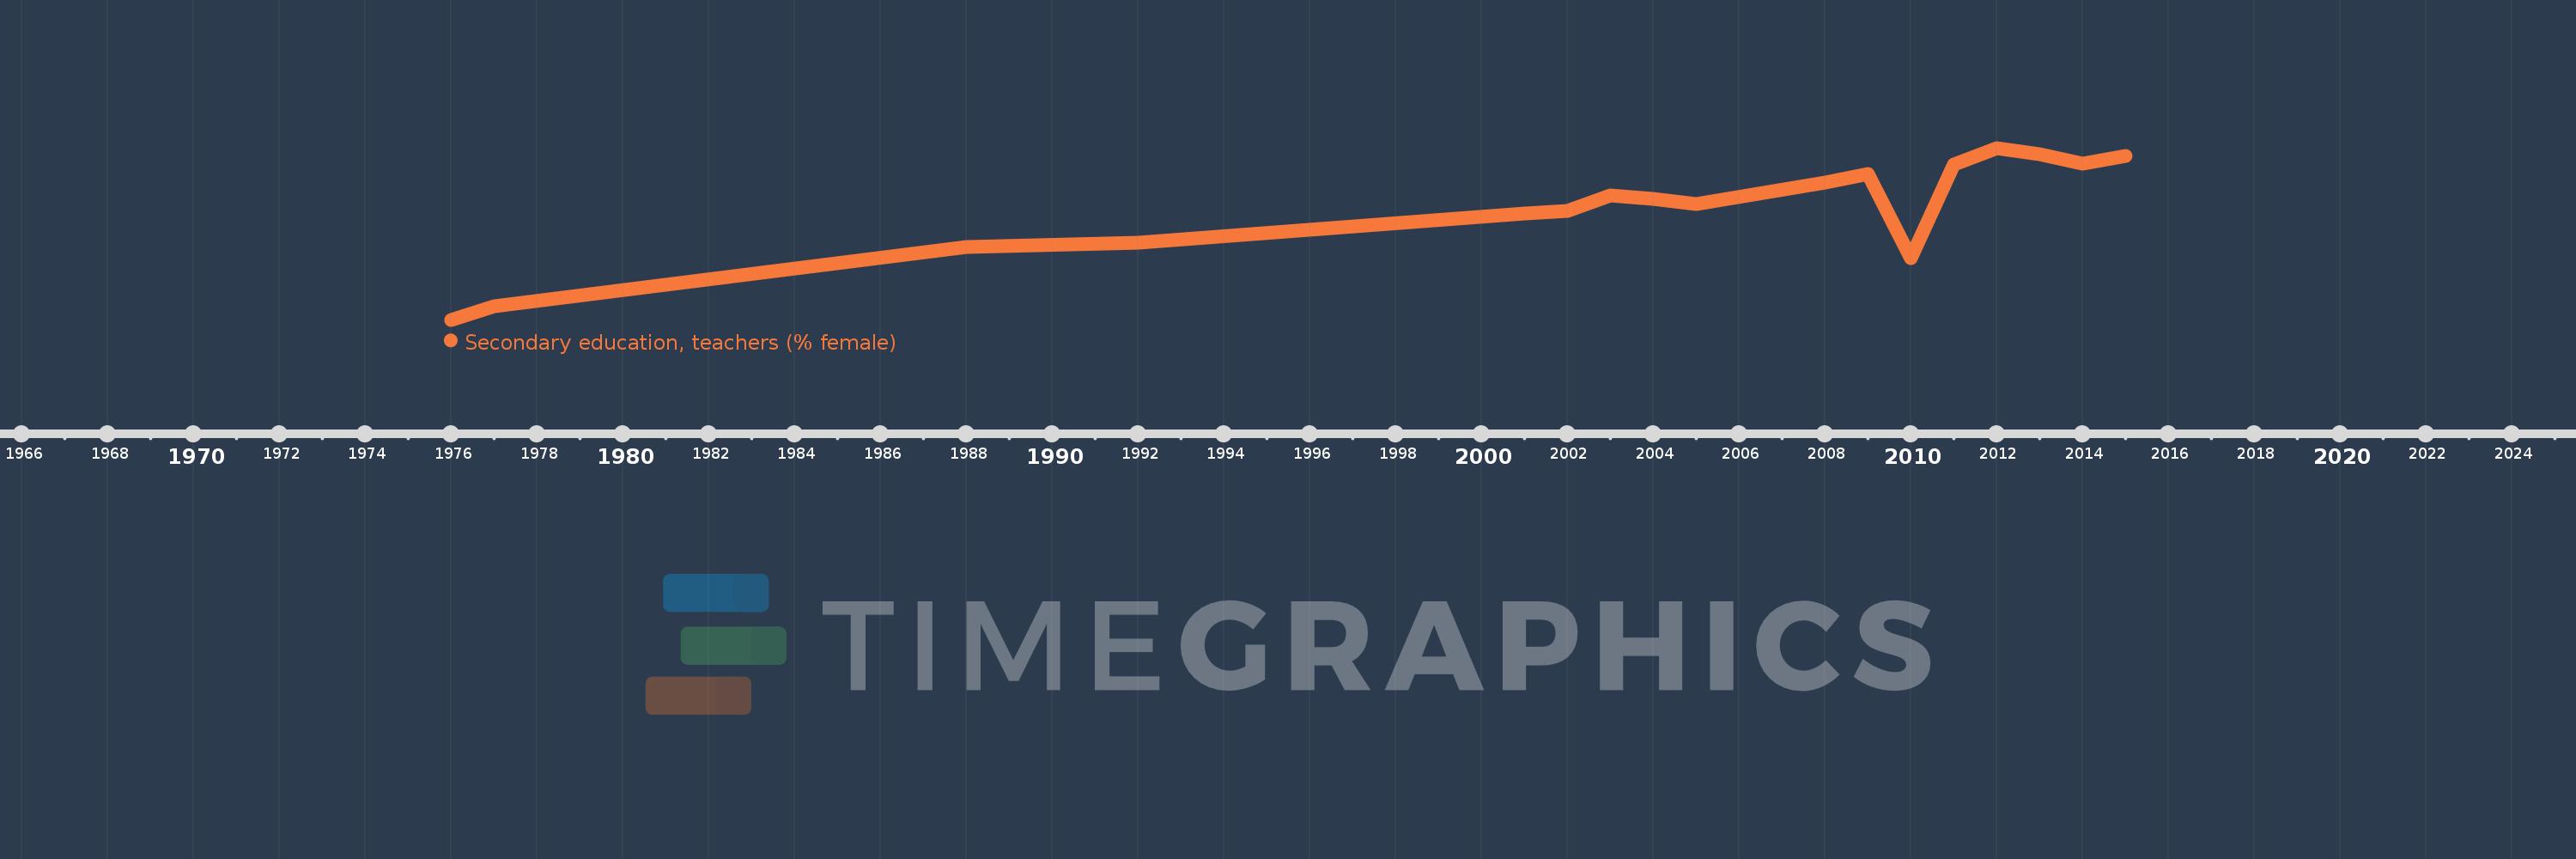
Questa scala temporale mostra un grafico dal 1976 anno al 2015 anno. St. Vincent and the Grenadines. I dati fino ad 1975 anno non disponibili. Il numero di osservazioni attuali secondo i date: 17.
La fonte (nome):
Indicatori dello sviluppo mondiale
La fonte (organizzazione):
United Nations Educational, Scientific, and Cultural Organization (UNESCO) Institute for Statistics.
Categorie:
Education, Gender
sono stati aggiornati
23 apr 2017 anni
Indicatori delle variazioni dei valori per anni
In media:
57.669
Minima:
40.816
1 gen 1976 anni
Massimo:
66.769
1 gen 2012 anni
Alla data di osservazione
Valore
Variazione assoluta
La variazione rispetto al valore precedente
1 gen 1976 anni
40.816
+40.816
0.0%
1 gen 1977 anni
42.798
+1.982
4.86%
1 gen 1988 anni
51.834
+9.035
21.11%
1 gen 1992 anni
52.436
+0.602
1.16%
1 gen 2001 anni
56.897
+4.46
8.51%
1 gen 2002 anni
57.284
+0.387
0.68%
1 gen 2003 anni
59.62
+2.336
4.08%
1 gen 2004 anni
59.039
-0.581
-0.97%
1 gen 2005 anni
58.261
-0.778
-1.32%
1 gen 2008 anni
61.511
+3.251
5.58%
1 gen 2009 anni
62.876
+1.365
2.22%
1 gen 2010 anni
50.113
-12.763
-20.3%
1 gen 2011 anni
64.265
+14.152
28.24%
1 gen 2012 anni
66.769
+2.505
3.9%
1 gen 2013 anni
65.882
-0.887
-1.33%
1 gen 2014 anni
64.448
-1.435
-2.18%
1 gen 2015 anni
65.522
+1.075
1.67%
Classificazione dei paesi secondo i statistiche attuali per anni