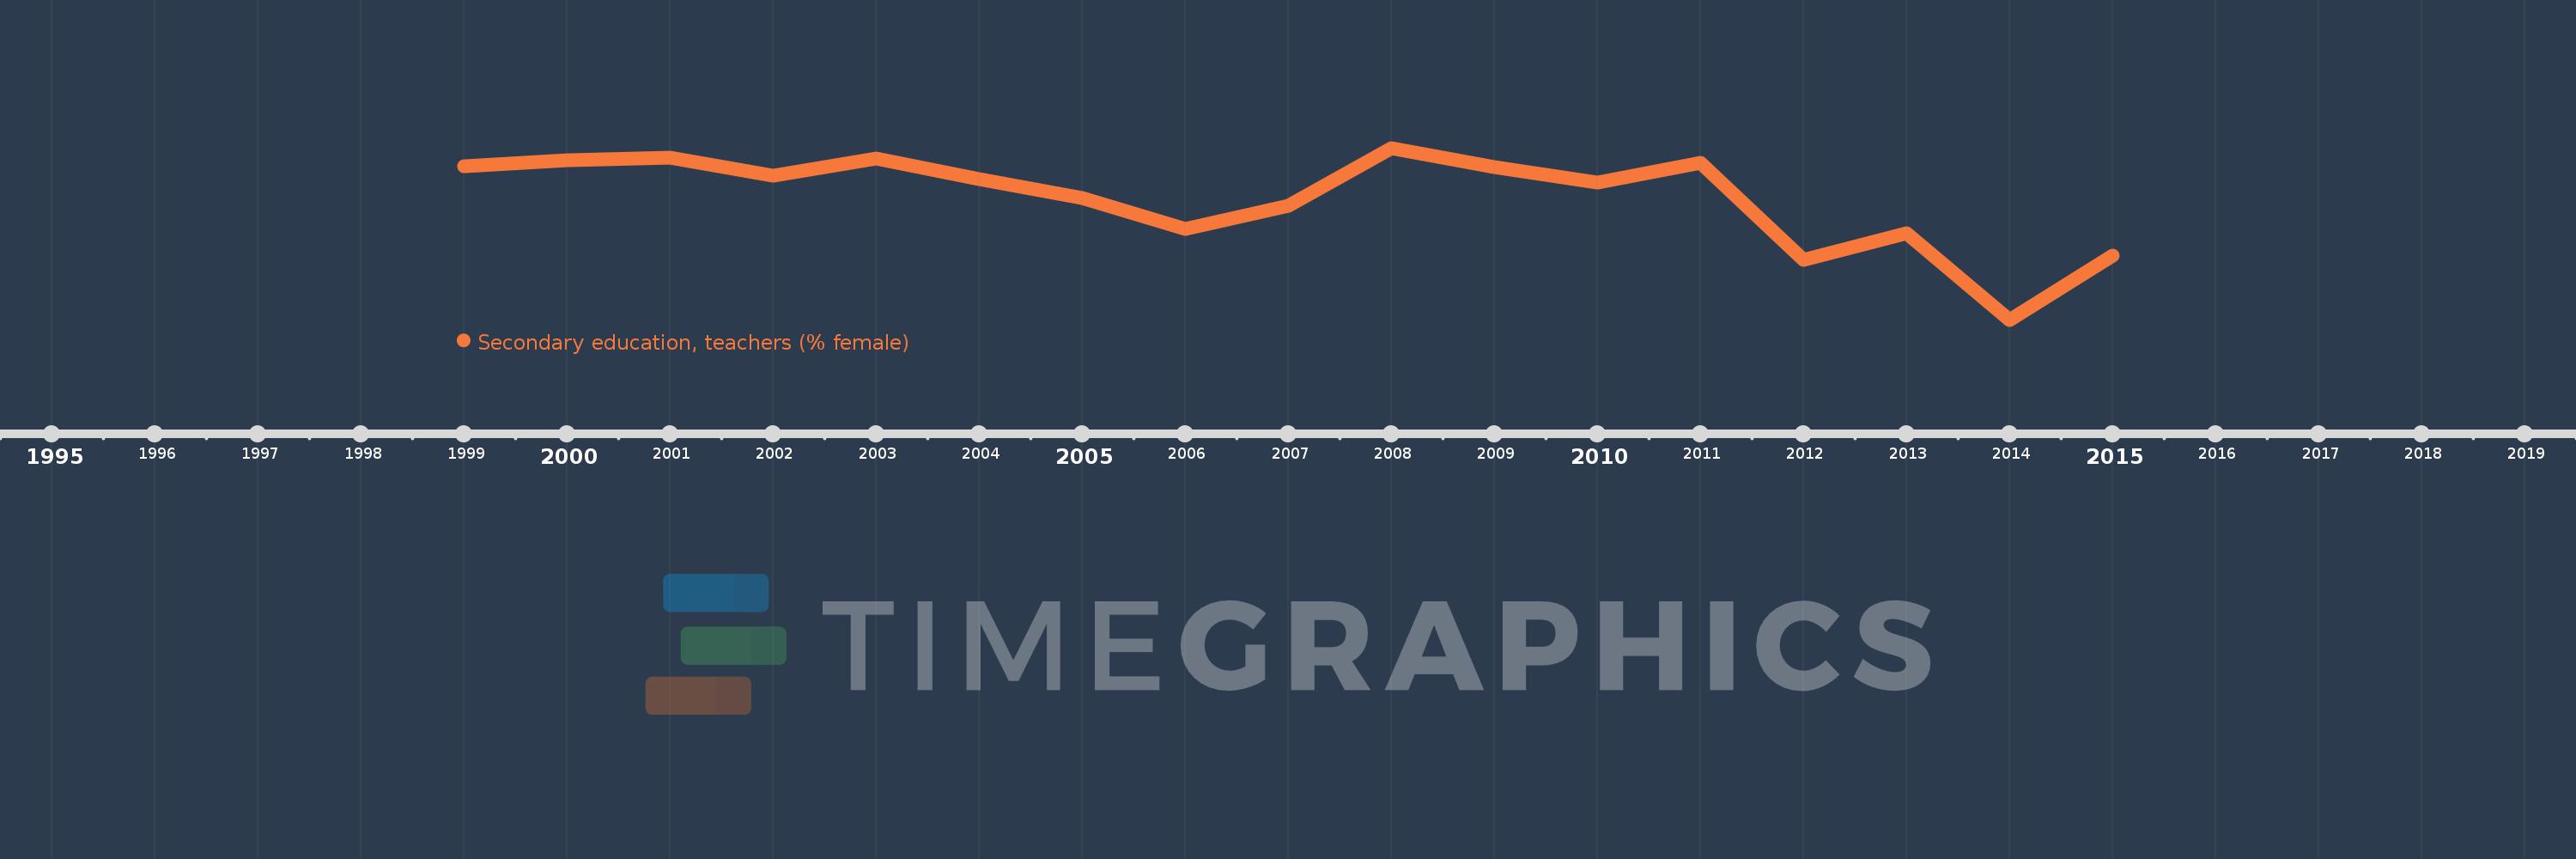
Questa scala temporale mostra un grafico dal 1999 anno al 2015 anno. Europe & Central Asia (excluding high income). I dati fino ad 1998 anno non disponibili. Il numero di osservazioni attuali secondo i date: 17.
La fonte (nome):
Indicatori dello sviluppo mondiale
La fonte (organizzazione):
United Nations Educational, Scientific, and Cultural Organization (UNESCO) Institute for Statistics.
Categorie:
Education, Gender
sono stati aggiornati
23 apr 2017 anni
Indicatori delle variazioni dei valori per anni
In media:
72.315
Minima:
71.522
1 gen 2014 anni
Massimo:
72.638
1 gen 2008 anni
Alla data di osservazione
Valore
Variazione assoluta
La variazione rispetto al valore precedente
1 gen 1999 anni
72.518
+72.518
0.0%
1 gen 2000 anni
72.556
+0.038
0.05%
1 gen 2001 anni
72.576
+0.02
0.03%
1 gen 2002 anni
72.46
-0.115
-0.16%
1 gen 2003 anni
72.567
+0.106
0.15%
1 gen 2004 anni
72.437
-0.13
-0.18%
1 gen 2005 anni
72.31
-0.127
-0.17%
1 gen 2006 anni
72.113
-0.198
-0.27%
1 gen 2007 anni
72.261
+0.149
0.21%
1 gen 2008 anni
72.638
+0.376
0.52%
1 gen 2009 anni
72.512
-0.126
-0.17%
1 gen 2010 anni
72.414
-0.098
-0.14%
1 gen 2011 anni
72.54
+0.126
0.17%
1 gen 2012 anni
71.91
-0.63
-0.87%
1 gen 2013 anni
72.086
+0.176
0.24%
1 gen 2014 anni
71.522
-0.564
-0.78%
1 gen 2015 anni
71.939
+0.417
0.58%
Classificazione dei paesi secondo i statistiche attuali per anni