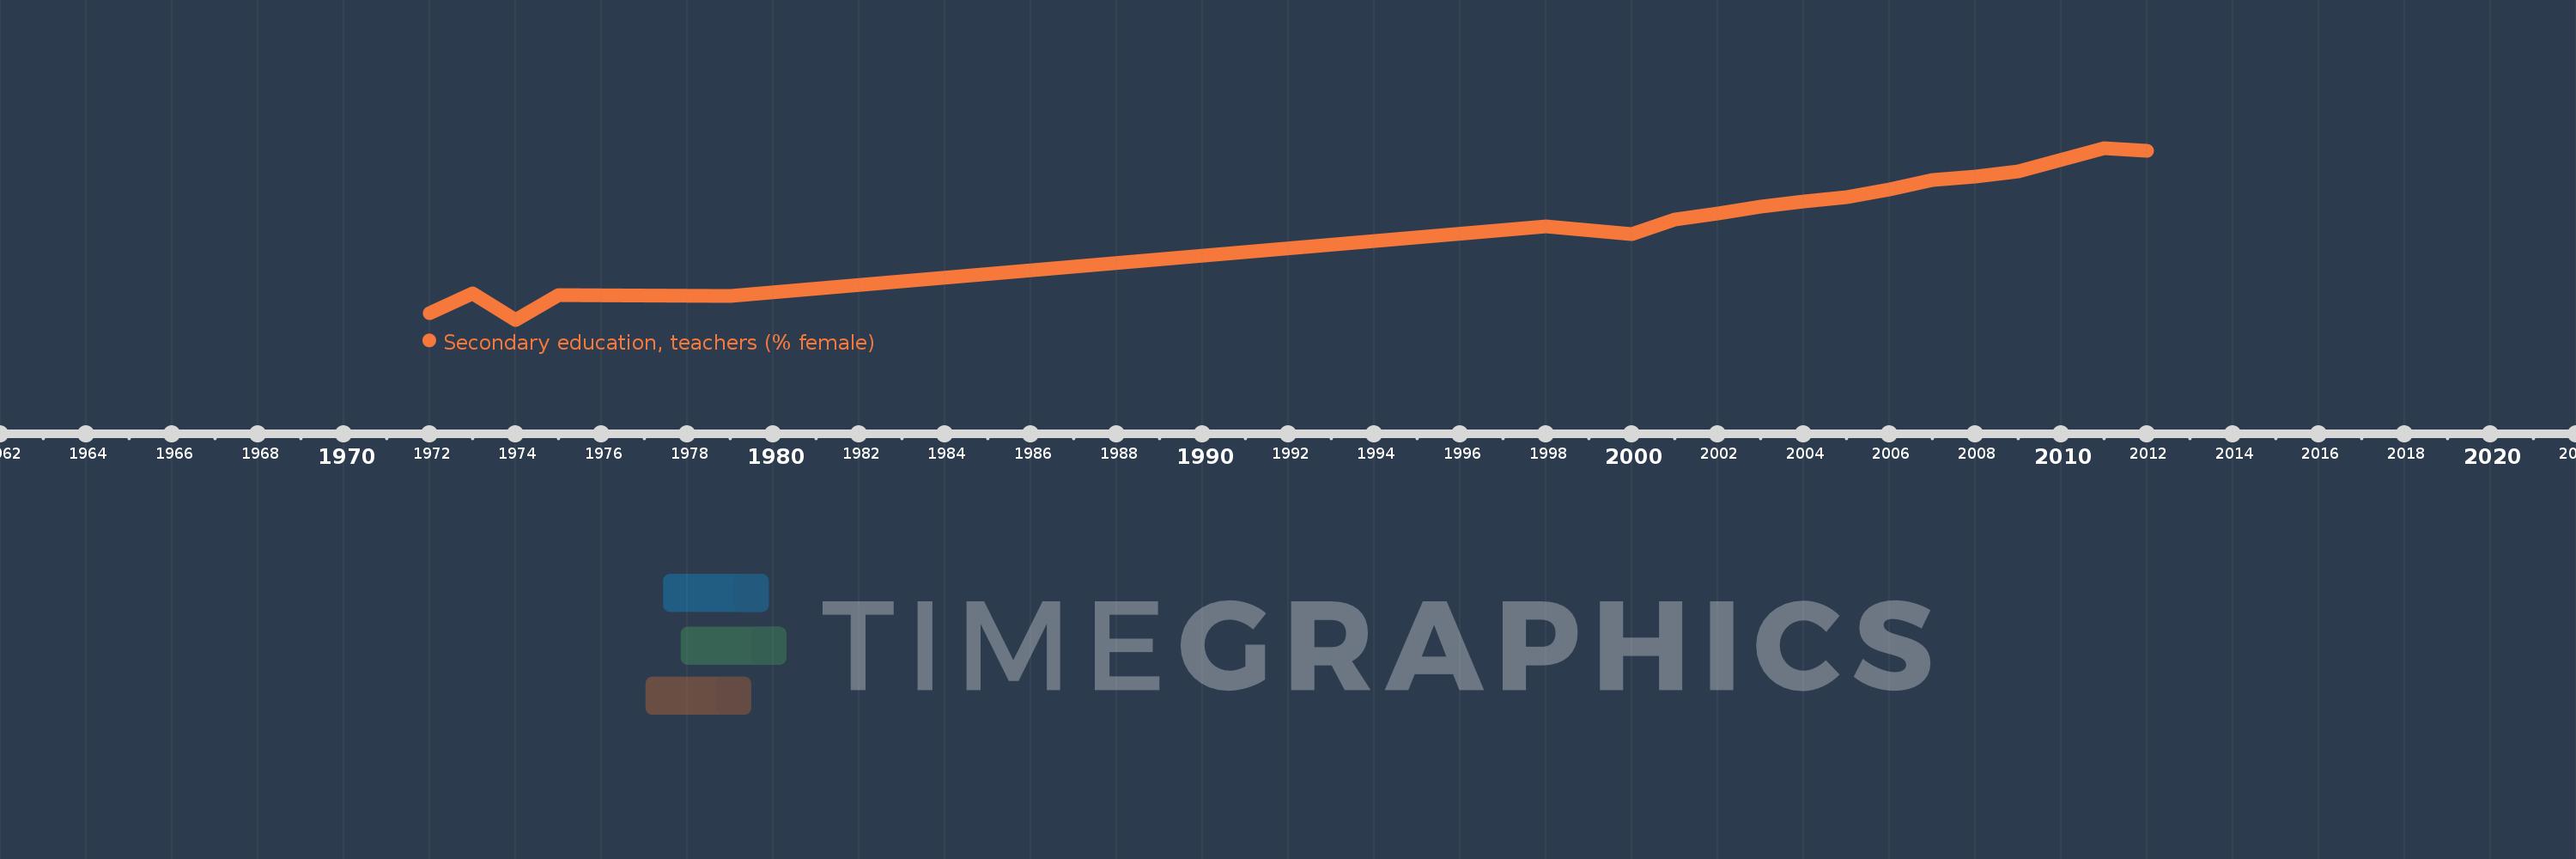
Questa scala temporale mostra un grafico dal 1972 anno al 2012 anno. Luxembourg. I dati fino ad 1971 anno non disponibili. Il numero di osservazioni attuali secondo i date: 18.
La fonte (nome):
Indicatori dello sviluppo mondiale
La fonte (organizzazione):
United Nations Educational, Scientific, and Cultural Organization (UNESCO) Institute for Statistics.
Categorie:
Education, Gender
sono stati aggiornati
23 apr 2017 anni
Indicatori delle variazioni dei valori per anni
In media:
39.464
Minima:
24.242
1 gen 1974 anni
Massimo:
51.568
1 gen 2011 anni
Alla data di osservazione
Valore
Variazione assoluta
La variazione rispetto al valore precedente
1 gen 1972 anni
25.293
+25.293
0.0%
1 gen 1973 anni
28.384
+3.091
12.22%
1 gen 1974 anni
24.242
-4.141
-14.59%
1 gen 1975 anni
28.119
+3.877
15.99%
1 gen 1979 anni
28.067
-0.052
-0.18%
1 gen 1998 anni
39.069
+11.002
39.2%
1 gen 2000 anni
37.858
-1.211
-3.1%
1 gen 2001 anni
40.218
+2.36
6.23%
1 gen 2002 anni
41.12
+0.902
2.24%
1 gen 2003 anni
42.202
+1.082
2.63%
1 gen 2004 anni
43.001
+0.799
1.89%
1 gen 2005 anni
43.703
+0.703
1.63%
1 gen 2006 anni
45.033
+1.329
3.04%
1 gen 2007 anni
46.523
+1.49
3.31%
1 gen 2008 anni
47.084
+0.561
1.21%
1 gen 2009 anni
47.784
+0.701
1.49%
1 gen 2011 anni
51.568
+3.783
7.92%
1 gen 2012 anni
51.078
-0.49
-0.95%
Classificazione dei paesi secondo i statistiche attuali per anni