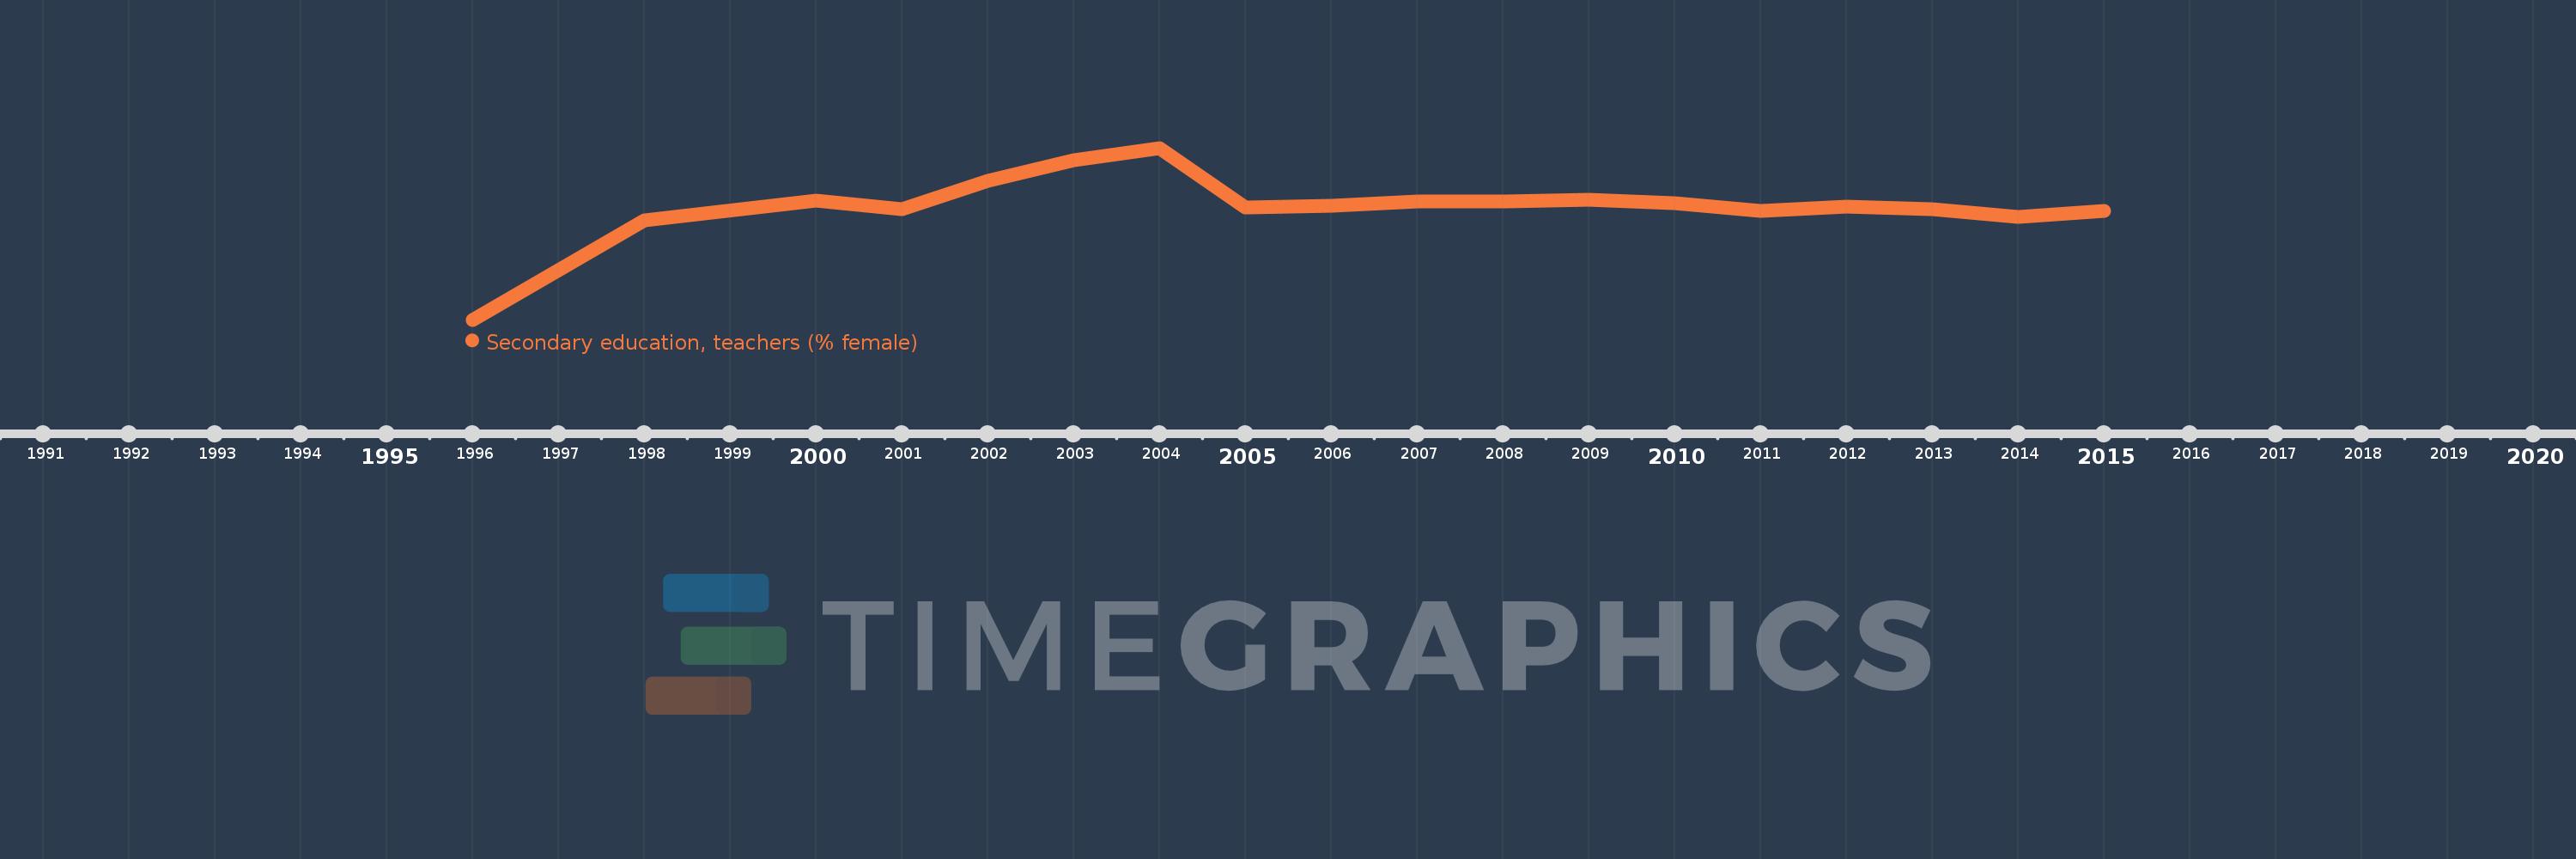
Questa scala temporale mostra un grafico dal 1996 anno al 2015 anno. Hungary. I dati fino ad 1995 anno non disponibili. Il numero di osservazioni attuali secondo i date: 18.
La fonte (nome):
Indicatori dello sviluppo mondiale
La fonte (organizzazione):
United Nations Educational, Scientific, and Cultural Organization (UNESCO) Institute for Statistics.
Categorie:
Education, Gender
sono stati aggiornati
23 apr 2017 anni
Indicatori delle variazioni dei valori per anni
In media:
71.179
Minima:
65.973
1 gen 1996 anni
Massimo:
73.851
1 gen 2004 anni
Alla data di osservazione
Valore
Variazione assoluta
La variazione rispetto al valore precedente
1 gen 1996 anni
65.973
+65.973
0.0%
1 gen 1998 anni
70.52
+4.547
6.89%
1 gen 2000 anni
71.454
+0.933
1.32%
1 gen 2001 anni
71.044
-0.41
-0.57%
1 gen 2002 anni
72.359
+1.315
1.85%
1 gen 2003 anni
73.289
+0.93
1.29%
1 gen 2004 anni
73.851
+0.562
0.77%
1 gen 2005 anni
71.128
-2.723
-3.69%
1 gen 2006 anni
71.2
+0.073
0.1%
1 gen 2007 anni
71.395
+0.195
0.27%
1 gen 2008 anni
71.379
-0.017
-0.02%
1 gen 2009 anni
71.471
+0.092
0.13%
1 gen 2010 anni
71.331
-0.14
-0.2%
1 gen 2011 anni
70.968
-0.363
-0.51%
1 gen 2012 anni
71.176
+0.208
0.29%
1 gen 2013 anni
71.025
-0.151
-0.21%
1 gen 2014 anni
70.687
-0.338
-0.48%
1 gen 2015 anni
70.976
+0.289
0.41%
Classificazione dei paesi secondo i statistiche attuali per anni