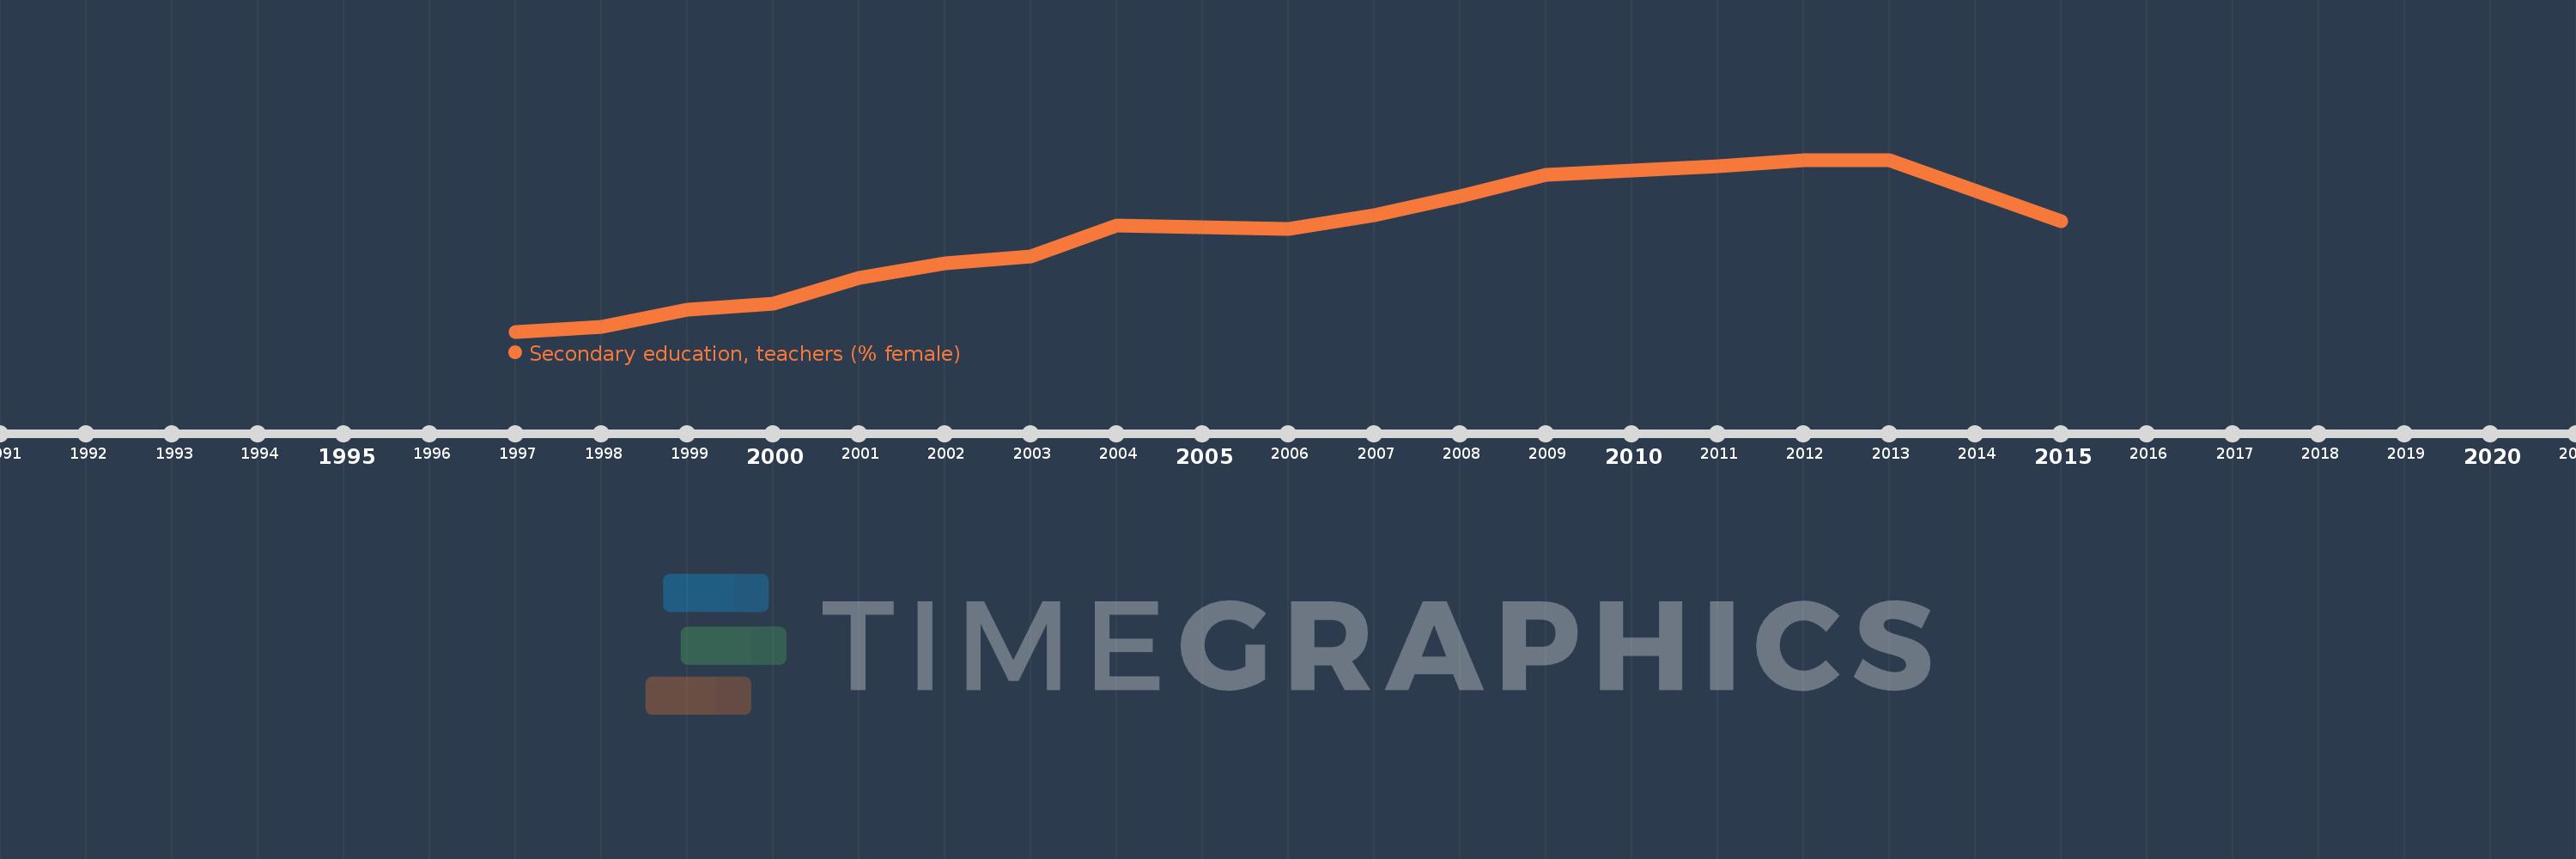
Questa scala temporale mostra un grafico dal 1997 anno al 2015 anno. Croatia. I dati fino ad 1996 anno non disponibili. Il numero di osservazioni attuali secondo i date: 16.
La fonte (nome):
Indicatori dello sviluppo mondiale
La fonte (organizzazione):
United Nations Educational, Scientific, and Cultural Organization (UNESCO) Institute for Statistics.
Categorie:
Education, Gender
sono stati aggiornati
23 apr 2017 anni
Indicatori delle variazioni dei valori per anni
In media:
66.542
Minima:
63.481
1 gen 1997 anni
Massimo:
69.138
1 gen 2012 anni
Alla data di osservazione
Valore
Variazione assoluta
La variazione rispetto al valore precedente
1 gen 1997 anni
63.481
+63.481
0.0%
1 gen 1998 anni
63.634
+0.152
0.24%
1 gen 1999 anni
64.193
+0.56
0.88%
1 gen 2000 anni
64.402
+0.209
0.33%
1 gen 2001 anni
65.236
+0.834
1.3%
1 gen 2002 anni
65.726
+0.49
0.75%
1 gen 2003 anni
65.953
+0.227
0.35%
1 gen 2004 anni
66.978
+1.025
1.55%
1 gen 2006 anni
66.868
-0.111
-0.17%
1 gen 2007 anni
67.309
+0.441
0.66%
1 gen 2008 anni
67.935
+0.626
0.93%
1 gen 2009 anni
68.653
+0.718
1.06%
1 gen 2011 anni
68.934
+0.281
0.41%
1 gen 2012 anni
69.138
+0.204
0.3%
1 gen 2013 anni
69.112
-0.027
-0.04%
1 gen 2015 anni
67.117
-1.995
-2.89%
Classificazione dei paesi secondo i statistiche attuali per anni