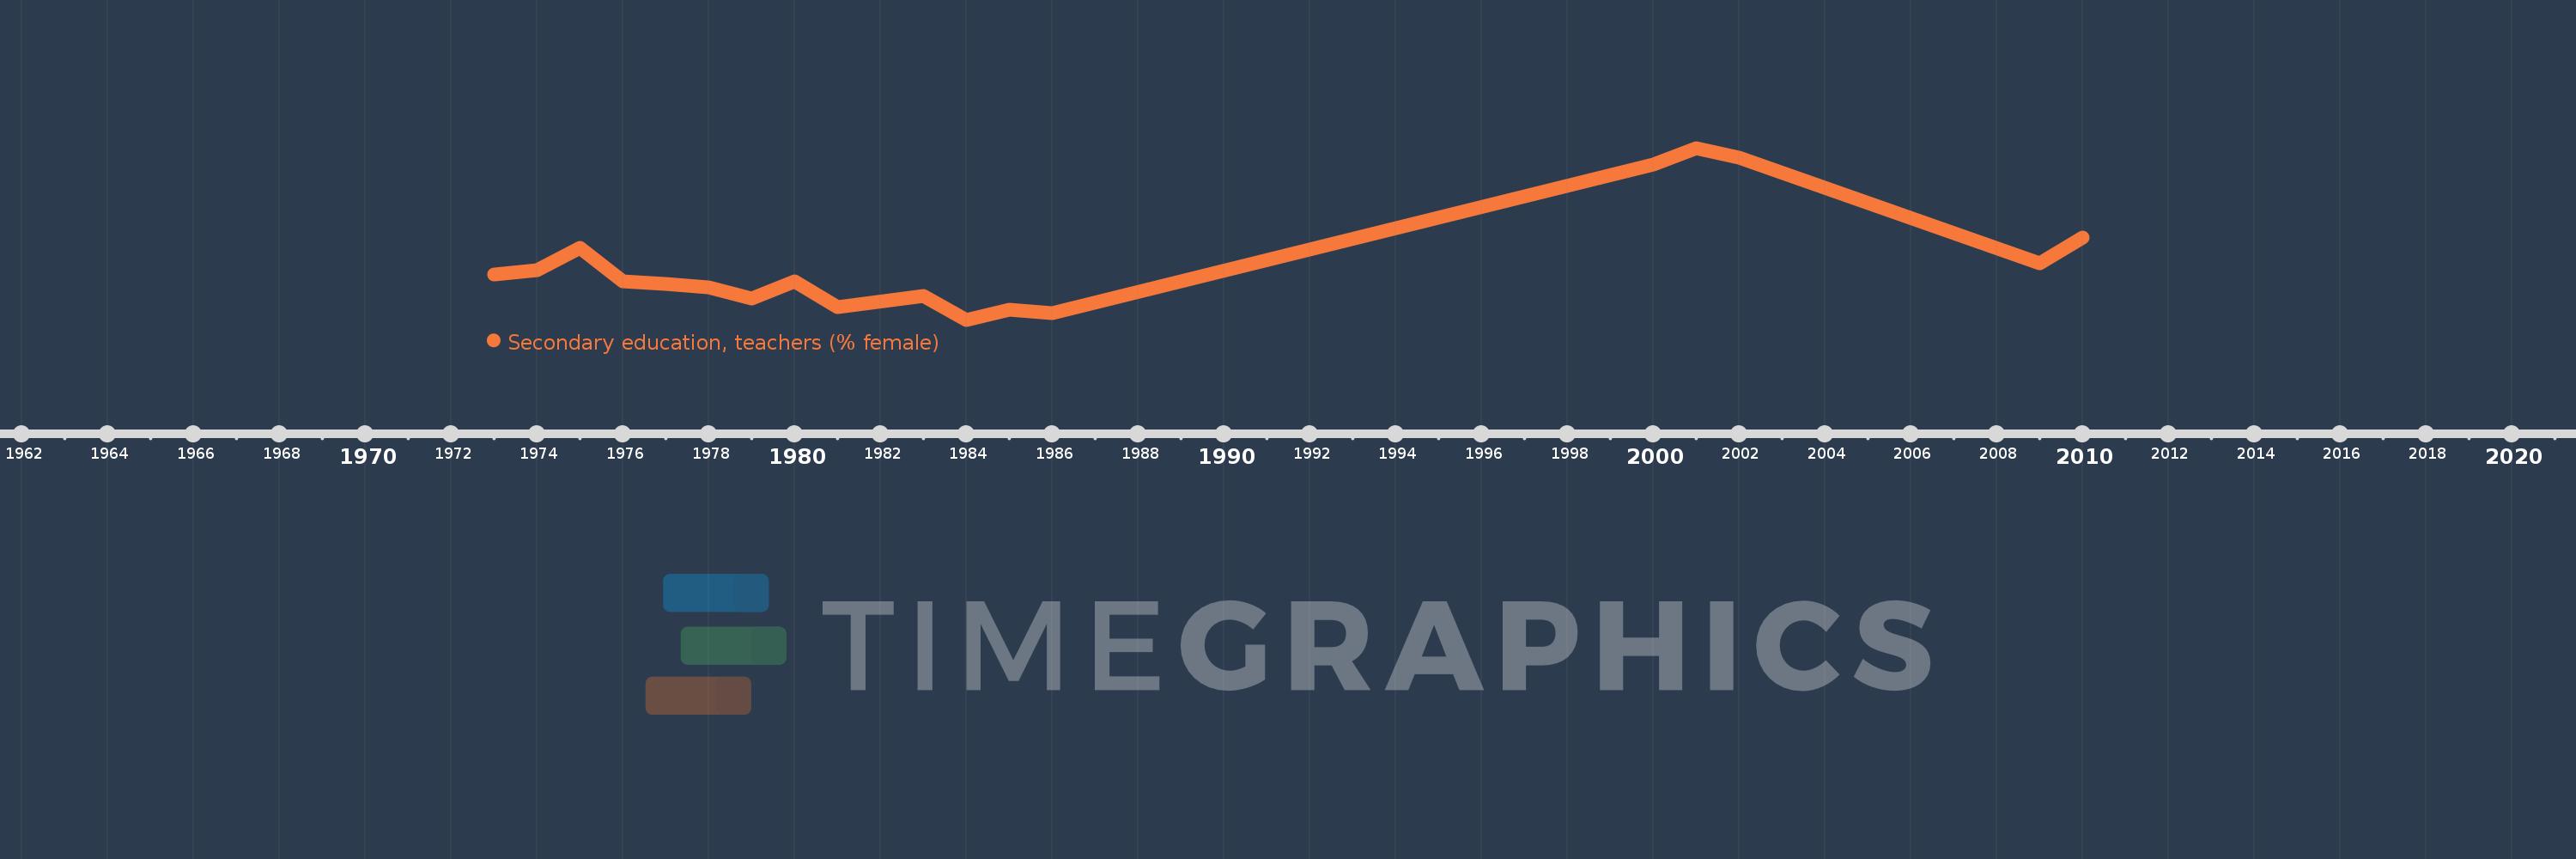
Questa scala temporale mostra un grafico dal 1973 anno al 2010 anno. Gibraltar. I dati fino ad 1972 anno non disponibili. Il numero di osservazioni attuali secondo i date: 18.
La fonte (nome):
Indicatori dello sviluppo mondiale
La fonte (organizzazione):
United Nations Educational, Scientific, and Cultural Organization (UNESCO) Institute for Statistics.
Categorie:
Education, Gender
sono stati aggiornati
23 apr 2017 anni
Indicatori delle variazioni dei valori per anni
In media:
42.941
Minima:
35.172
1 gen 1984 anni
Massimo:
58.871
1 gen 2001 anni
Alla data di osservazione
Valore
Variazione assoluta
La variazione rispetto al valore precedente
1 gen 1973 anni
41.429
+41.429
0.0%
1 gen 1974 anni
41.985
+0.556
1.34%
1 gen 1975 anni
45.07
+3.086
7.35%
1 gen 1976 anni
40.411
-4.659
-10.34%
1 gen 1977 anni
40.152
-0.259
-0.64%
1 gen 1978 anni
39.695
-0.457
-1.14%
1 gen 1979 anni
38.13
-1.565
-3.94%
1 gen 1980 anni
40.441
+2.312
6.06%
1 gen 1981 anni
36.879
-3.562
-8.81%
1 gen 1983 anni
38.462
+1.582
4.29%
1 gen 1984 anni
35.172
-3.289
-8.55%
1 gen 1985 anni
36.552
+1.379
3.92%
1 gen 1986 anni
36.111
-0.441
-1.21%
1 gen 2000 anni
56.557
+20.446
56.62%
1 gen 2001 anni
58.871
+2.314
4.09%
1 gen 2002 anni
57.576
-1.295
-2.2%
1 gen 2009 anni
42.997
-14.579
-25.32%
1 gen 2010 anni
46.454
+3.457
8.04%
Classificazione dei paesi secondo i statistiche attuali per anni