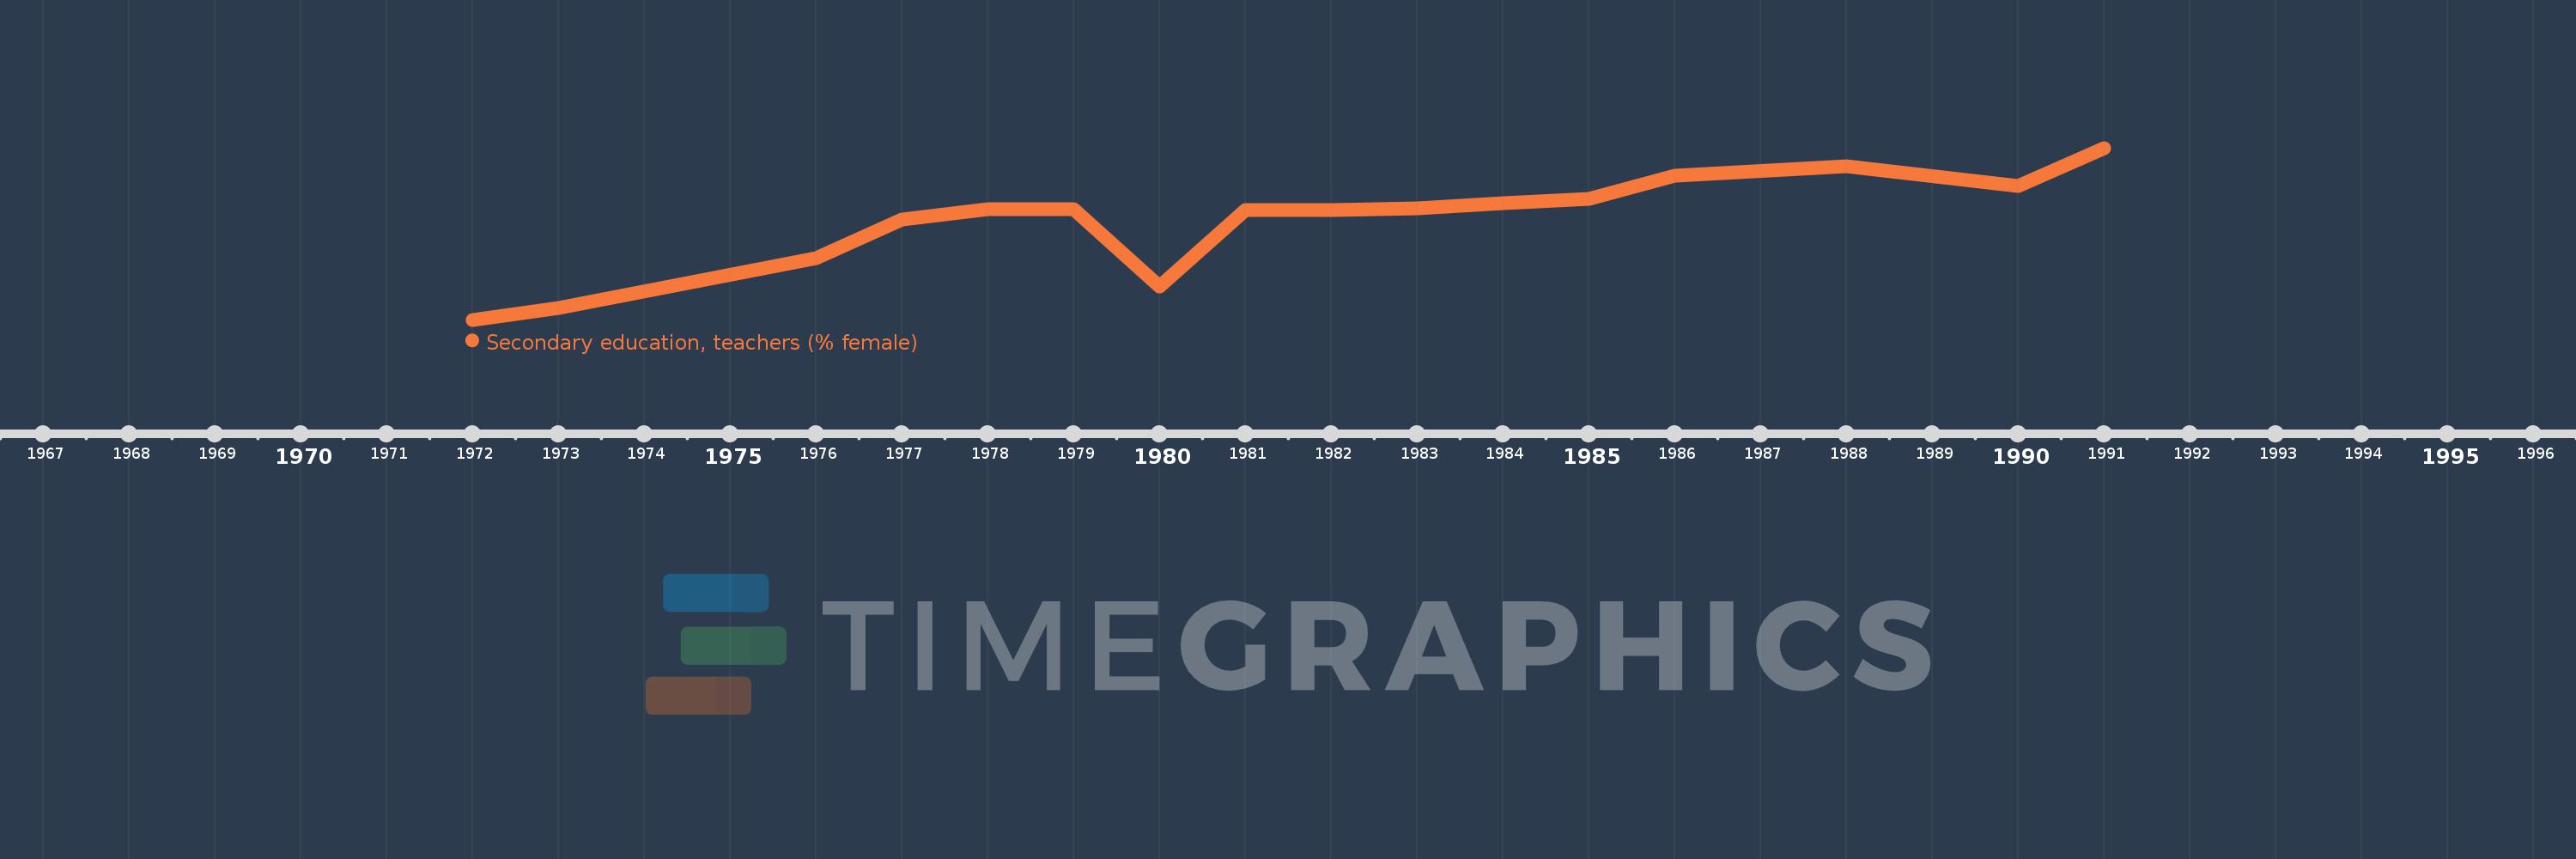
Questa scala temporale mostra un grafico dal 1972 anno al 1991 anno. Pakistan. I dati fino ad 1971 anno non disponibili. Il numero di osservazioni attuali secondo i date: 16.
La fonte (nome):
Indicatori dello sviluppo mondiale
La fonte (organizzazione):
United Nations Educational, Scientific, and Cultural Organization (UNESCO) Institute for Statistics.
Categorie:
Education, Gender
sono stati aggiornati
23 apr 2017 anni
Indicatori delle variazioni dei valori per anni
In media:
29.426
Minima:
26.194
1 gen 1972 anni
Massimo:
31.75
1 gen 1991 anni
Alla data di osservazione
Valore
Variazione assoluta
La variazione rispetto al valore precedente
1 gen 1972 anni
26.194
+26.194
0.0%
1 gen 1973 anni
26.587
+0.393
1.5%
1 gen 1976 anni
28.172
+1.585
5.96%
1 gen 1977 anni
29.443
+1.271
4.51%
1 gen 1978 anni
29.758
+0.316
1.07%
1 gen 1979 anni
29.781
+0.022
0.07%
1 gen 1980 anni
27.267
-2.514
-8.44%
1 gen 1981 anni
29.749
+2.482
9.1%
1 gen 1982 anni
29.733
-0.015
-0.05%
1 gen 1983 anni
29.79
+0.056
0.19%
1 gen 1984 anni
29.954
+0.164
0.55%
1 gen 1985 anni
30.102
+0.147
0.49%
1 gen 1986 anni
30.864
+0.762
2.53%
1 gen 1988 anni
31.154
+0.29
0.94%
1 gen 1990 anni
30.525
-0.629
-2.02%
1 gen 1991 anni
31.75
+1.225
4.01%
Classificazione dei paesi secondo i statistiche attuali per anni