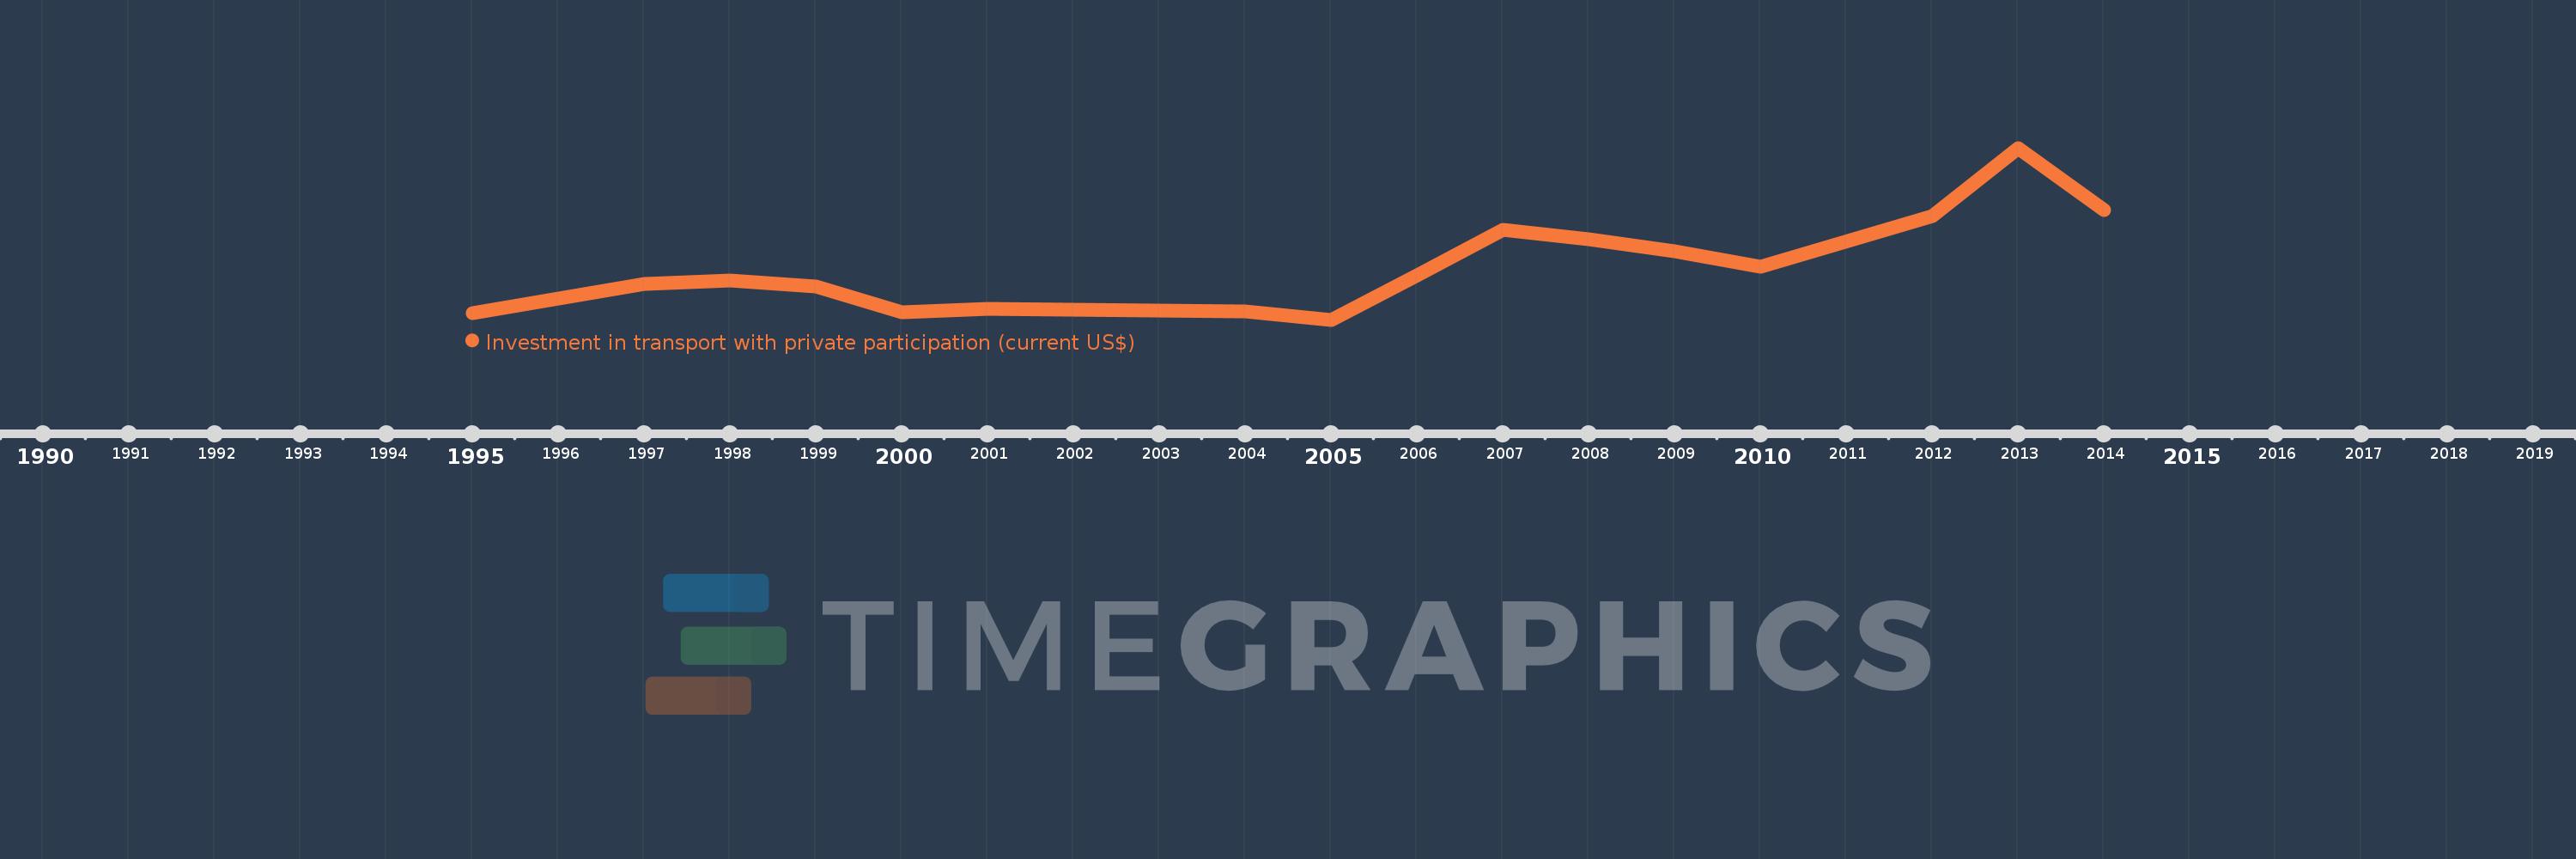
Questa scala temporale mostra un grafico dal 1995 anno al 2014 anno. Middle income. I dati fino ad 1994 anno non disponibili. Il numero di osservazioni attuali secondo i date: 16.
La fonte (nome):
Indicatori dello sviluppo mondiale
La fonte (organizzazione):
World Bank, Private Participation in Infrastructure Project Database (http://ppi.worldbank.org).
Categorie:
Infrastructure, Private Sector
sono stati aggiornati
23 apr 2017 anni
Indicatori delle variazioni dei valori per anni
In media:
21.111 Mlrd
Minima:
4.649 Mlrd
1 gen 2005 anni
Massimo:
57.075 Mlrd
1 gen 2013 anni
Alla data di osservazione
Valore
Variazione assoluta
La variazione rispetto al valore precedente
1 gen 1995 anni
6.651 Mlrd
+6.651 Mlrd
0.0%
1 gen 1997 anni
15.459 Mlrd
+8.808 Mlrd
132.43%
1 gen 1998 anni
16.609 Mlrd
+1.15 Mlrd
7.44%
1 gen 1999 anni
14.884 Mlrd
-1.725 Mlrd
-10.38%
1 gen 2000 anni
7.02 Mlrd
-7.865 Mlrd
-52.84%
1 gen 2001 anni
7.87 Mlrd
+850.12 Mln
12.11%
1 gen 2004 anni
7.26 Mlrd
-610.06 Mln
-7.75%
1 gen 2005 anni
4.649 Mlrd
-2.611 Mlrd
-35.96%
1 gen 2006 anni
18.195 Mlrd
+13.546 Mlrd
291.38%
1 gen 2007 anni
32.039 Mlrd
+13.844 Mlrd
76.09%
1 gen 2008 anni
29.227 Mlrd
-2.811 Mlrd
-8.78%
1 gen 2009 anni
25.521 Mlrd
-3.707 Mlrd
-12.68%
1 gen 2010 anni
20.809 Mlrd
-4.712 Mlrd
-18.46%
1 gen 2012 anni
36.396 Mlrd
+15.588 Mlrd
74.91%
1 gen 2013 anni
57.075 Mlrd
+20.679 Mlrd
56.82%
1 gen 2014 anni
38.111 Mlrd
-18.964 Mlrd
-33.23%
Classificazione dei paesi secondo i statistiche attuali per anni