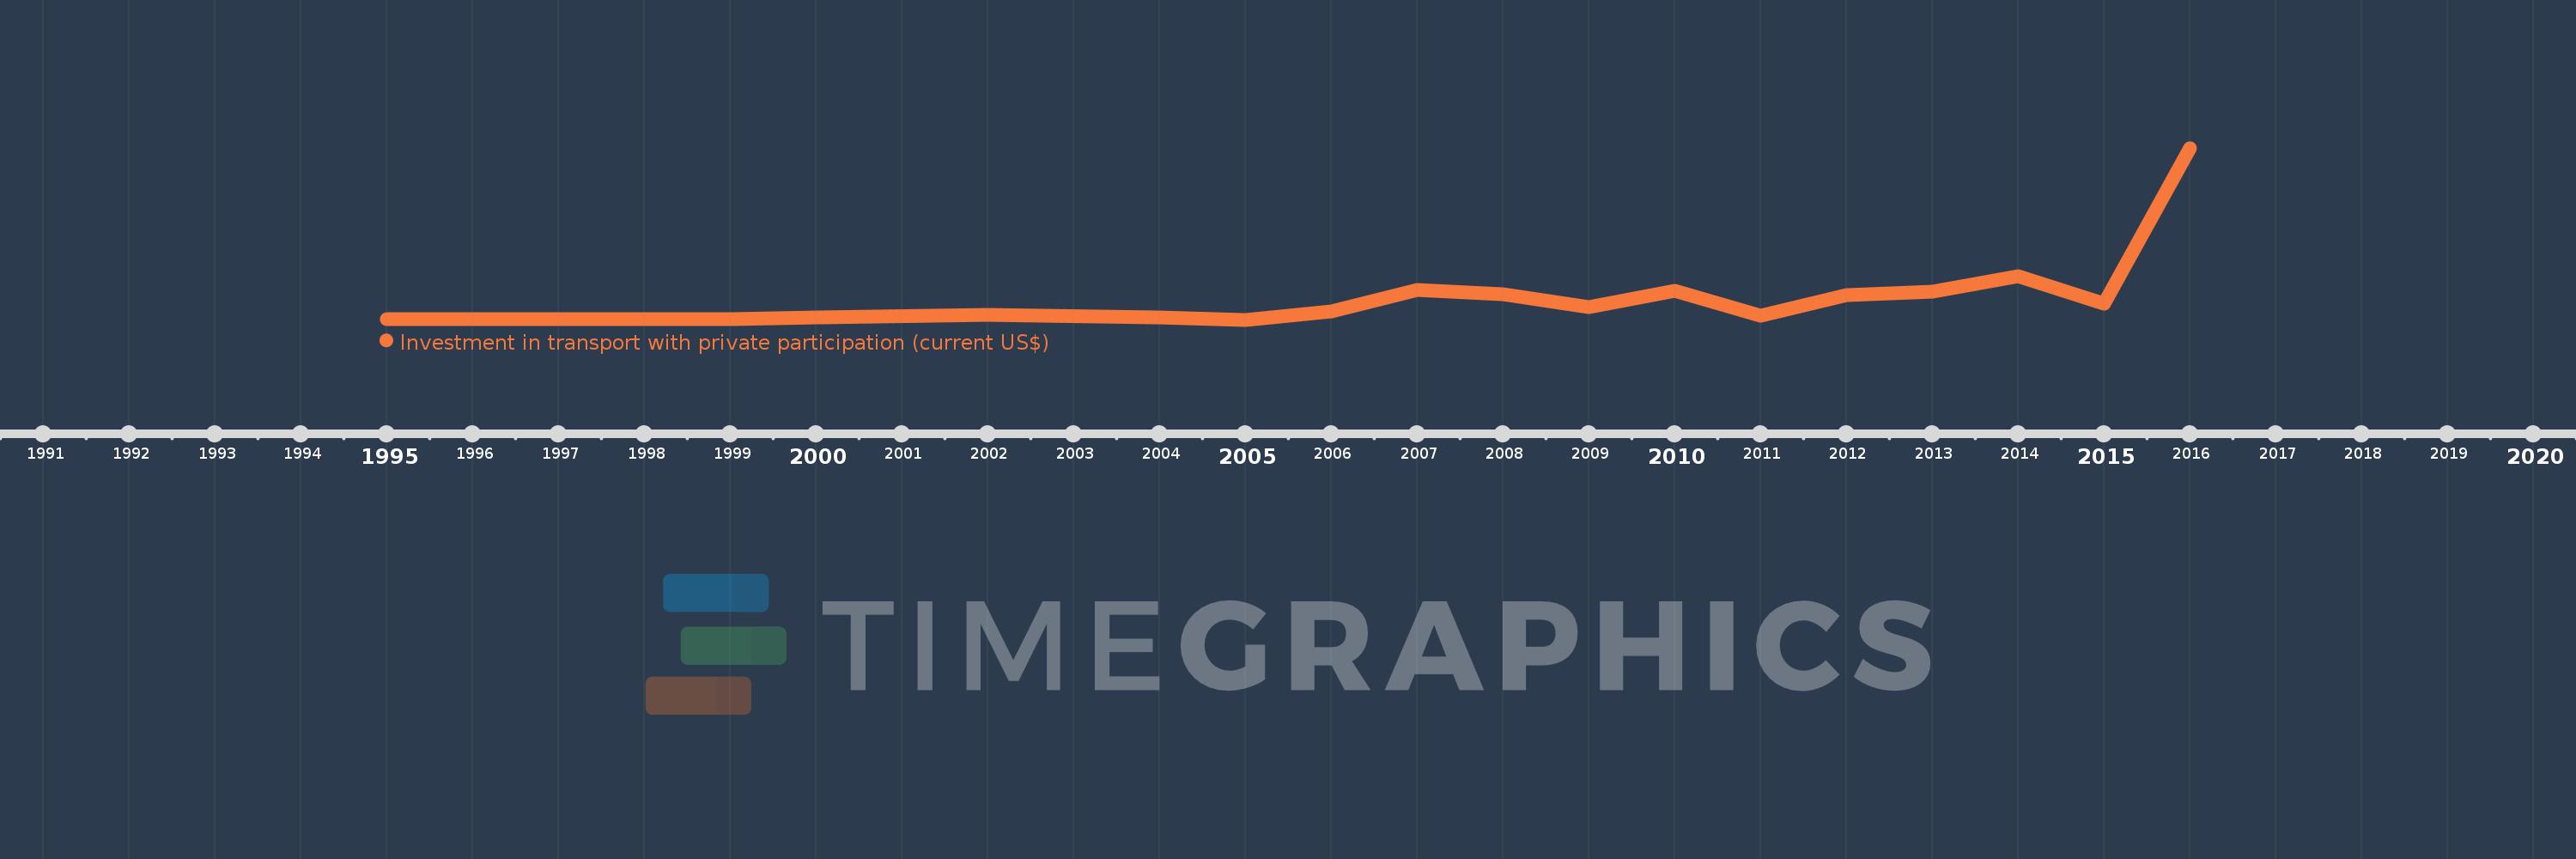
Questa scala temporale mostra un grafico dal 1995 anno al 2016 anno. Peru. I dati fino ad 1994 anno non disponibili. Il numero di osservazioni attuali secondo i date: 17.
La fonte (nome):
Indicatori dello sviluppo mondiale
La fonte (organizzazione):
World Bank, Private Participation in Infrastructure Project Database (http://ppi.worldbank.org).
Categorie:
Infrastructure, Private Sector
sono stati aggiornati
23 apr 2017 anni
Indicatori delle variazioni dei valori per anni
In media:
817.884 Mln
Minima:
0.0
1 gen 2005 anni
Massimo:
5.925 Mlrd
1 gen 2016 anni
Alla data di osservazione
Valore
Variazione assoluta
La variazione rispetto al valore precedente
1 gen 1995 anni
6.6 Mln
+6.6 Mln
0.0%
1 gen 1999 anni
8.0 Mln
+1.4 Mln
21.21%
1 gen 2000 anni
78.3 Mln
+70.3 Mln
878.75%
1 gen 2002 anni
164.5 Mln
+86.2 Mln
110.09%
1 gen 2004 anni
75.0 Mln
-89.5 Mln
-54.41%
1 gen 2005 anni
0.0
-75.0 Mln
-100.0%
1 gen 2006 anni
283.0 Mln
+283.0 Mln
%
1 gen 2007 anni
1.02 Mlrd
+737.0 Mln
260.42%
1 gen 2008 anni
875.8 Mln
-144.2 Mln
-14.14%
1 gen 2009 anni
439.0 Mln
-436.8 Mln
-49.87%
1 gen 2010 anni
987.83 Mln
+548.83 Mln
125.02%
1 gen 2011 anni
127.0 Mln
-860.83 Mln
-87.14%
1 gen 2012 anni
860.0 Mln
+733.0 Mln
577.17%
1 gen 2013 anni
983.0 Mln
+123.0 Mln
14.3%
1 gen 2014 anni
1.506 Mlrd
+523.0 Mln
53.2%
1 gen 2015 anni
565.0 Mln
-941.0 Mln
-62.48%
1 gen 2016 anni
5.925 Mlrd
+5.36 Mlrd
948.67%
Classificazione dei paesi secondo i statistiche attuali per anni