Download Queste statistiche in altri paesi:
Linea del tempo:
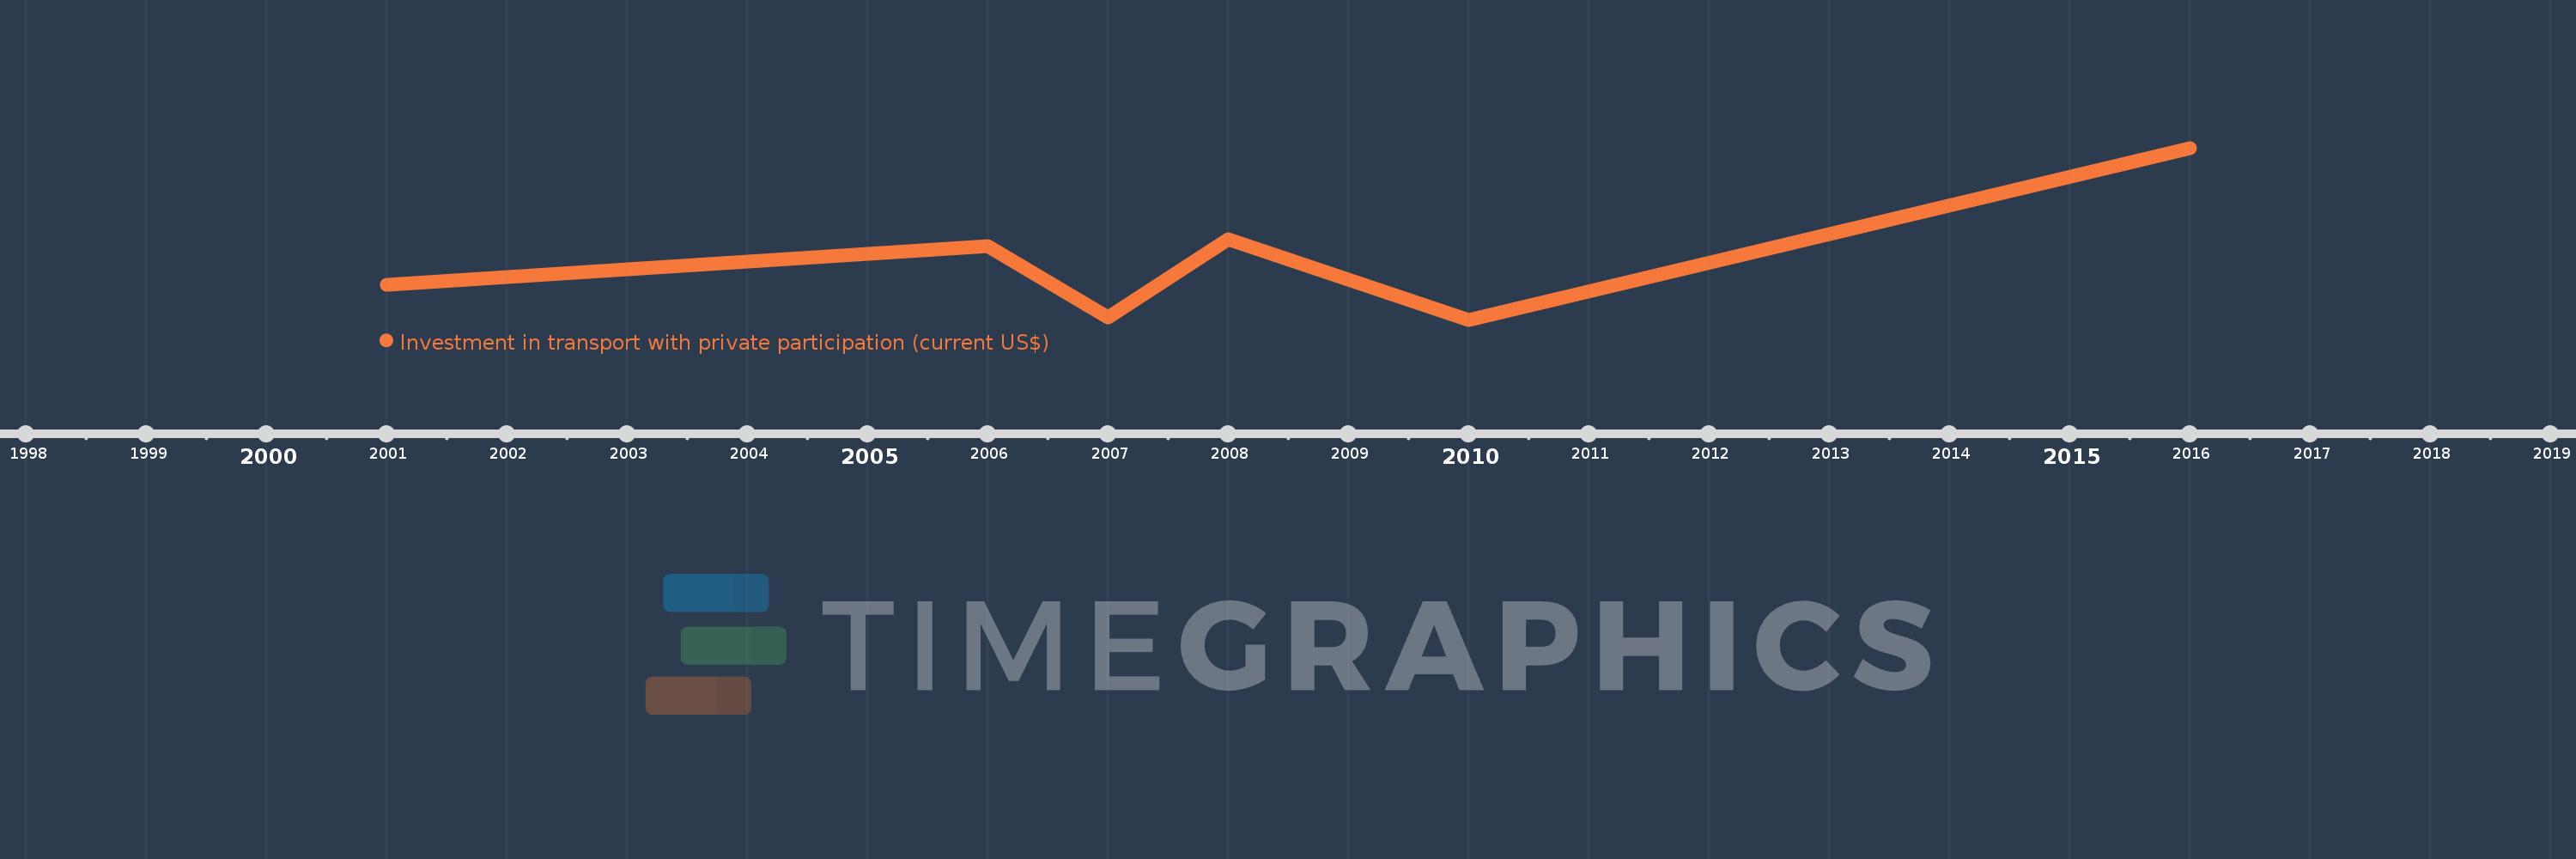
Questa scala temporale mostra un grafico dal 2001 anno al 2016 anno. Costa Rica. I dati fino ad 2000 anno non disponibili. Il numero di osservazioni attuali secondo i date: 6.
La fonte (nome):
Indicatori dello sviluppo mondiale
La fonte (organizzazione):
World Bank, Private Participation in Infrastructure Project Database (http://ppi.worldbank.org).
Categorie:
Infrastructure, Private Sector
sono stati aggiornati
23 apr 2017 anni
Indicatori delle variazioni dei valori per anni
Minima:
34.0 Mln
1 gen 2010 anni
Massimo:
663.0 Mln
1 gen 2016 anni
Alla data di osservazione
Valore
Variazione assoluta
La variazione rispetto al valore precedente
1 gen 2001 anni
161.0 Mln
+161.0 Mln
0.0%
1 gen 2006 anni
304.2 Mln
+143.2 Mln
88.94%
1 gen 2007 anni
43.0 Mln
-261.2 Mln
-85.86%
1 gen 2008 anni
330.0 Mln
+287.0 Mln
667.44%
1 gen 2010 anni
34.0 Mln
-296.0 Mln
-89.7%
1 gen 2016 anni
663.0 Mln
+629.0 Mln
1.85 Mille.%
Classificazione dei paesi secondo i statistiche attuali per anni