Download Queste statistiche in altri paesi:
Linea del tempo:
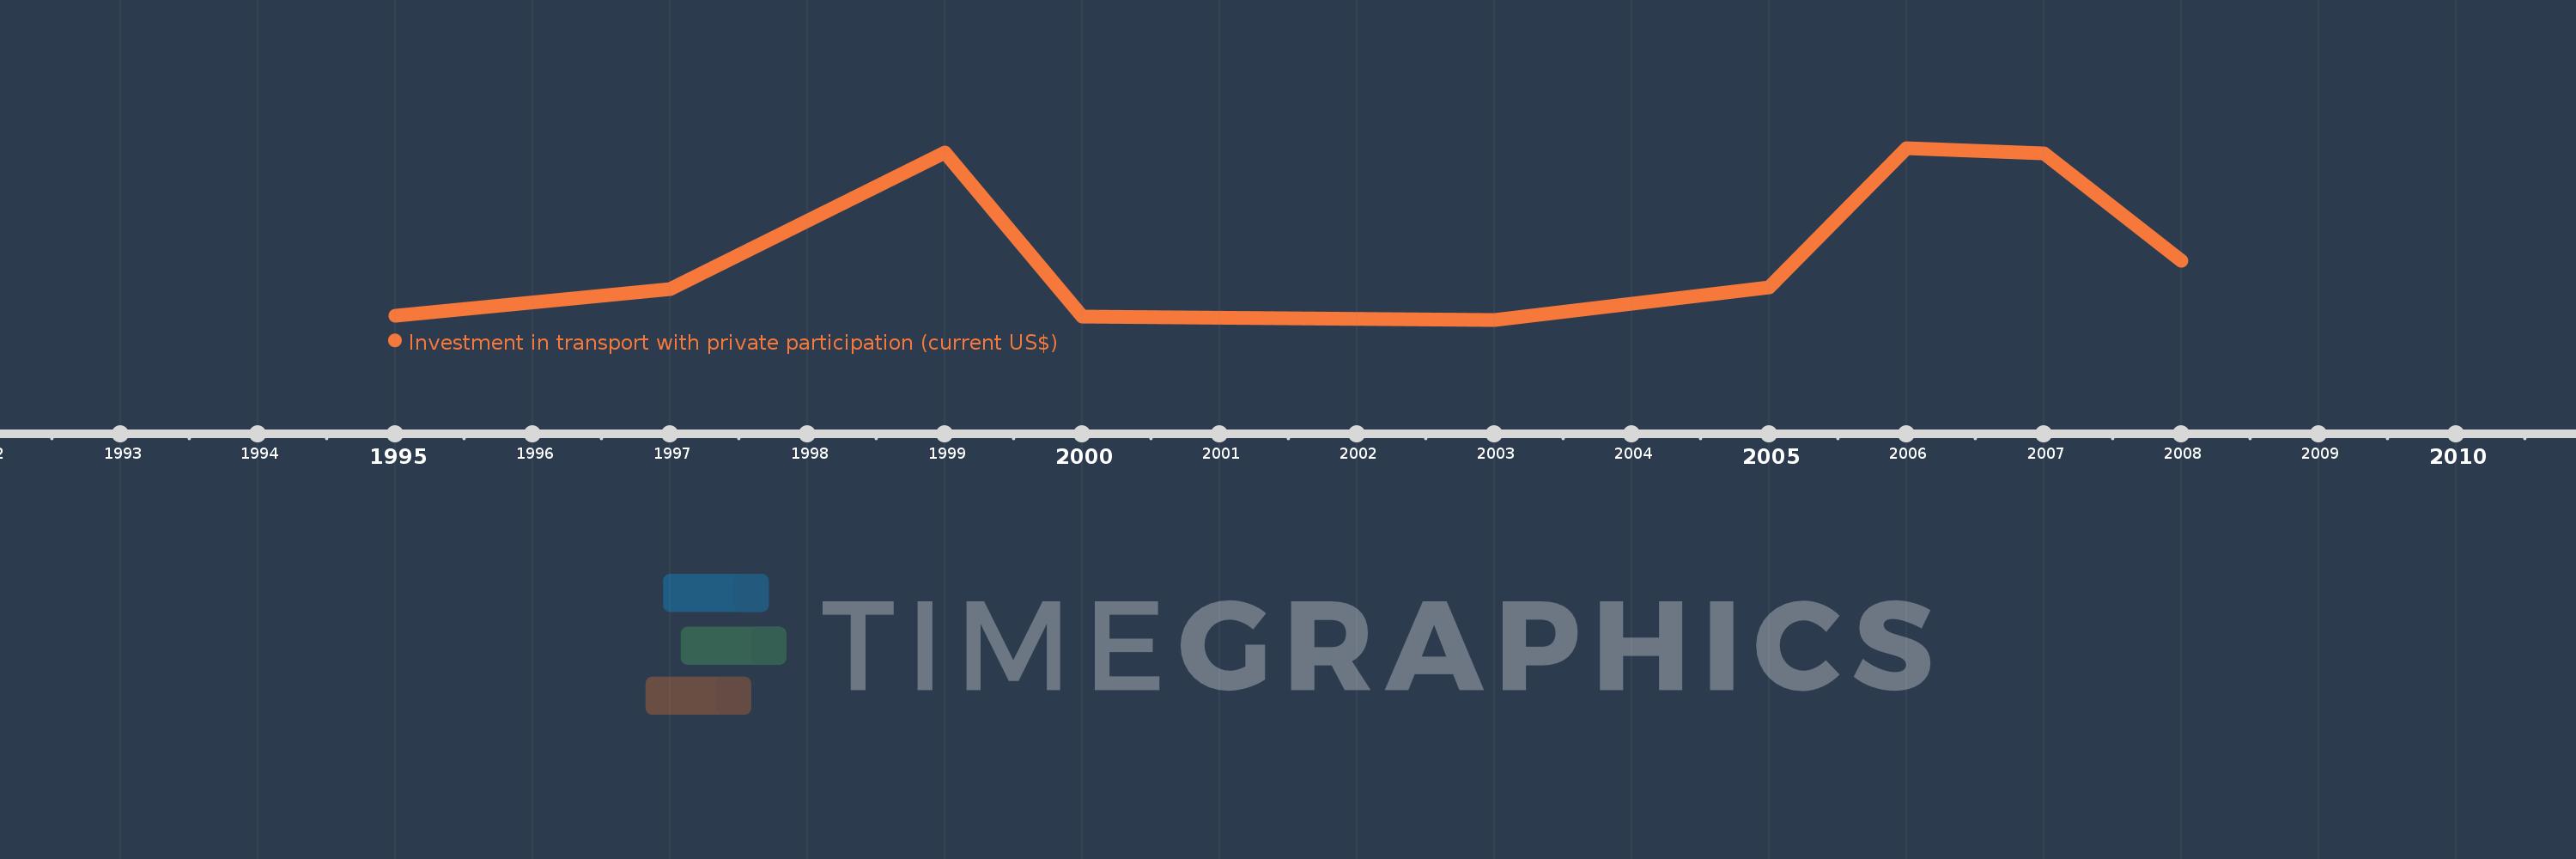
Questa scala temporale mostra un grafico dal 1995 anno al 2008 anno. Ecuador. I dati fino ad 1994 anno non disponibili. Il numero di osservazioni attuali secondo i date: 9.
La fonte (nome):
Indicatori dello sviluppo mondiale
La fonte (organizzazione):
World Bank, Private Participation in Infrastructure Project Database (http://ppi.worldbank.org).
Categorie:
Infrastructure, Private Sector
sono stati aggiornati
23 apr 2017 anni
Indicatori delle variazioni dei valori per anni
Minima:
0.0
1 gen 2003 anni
Massimo:
585.0 Mln
1 gen 2006 anni
Alla data di osservazione
Valore
Variazione assoluta
La variazione rispetto al valore precedente
1 gen 1995 anni
12.5 Mln
+12.5 Mln
0.0%
1 gen 1997 anni
105.0 Mln
+92.5 Mln
740.0%
1 gen 1999 anni
569.8 Mln
+464.8 Mln
442.67%
1 gen 2000 anni
12.0 Mln
-557.8 Mln
-97.89%
1 gen 2003 anni
0.0
-12.0 Mln
-100.0%
1 gen 2005 anni
110.0 Mln
+110.0 Mln
%
1 gen 2006 anni
585.0 Mln
+475.0 Mln
431.82%
1 gen 2007 anni
566.0 Mln
-19.0 Mln
-3.25%
1 gen 2008 anni
200.0 Mln
-366.0 Mln
-64.66%
Classificazione dei paesi secondo i statistiche attuali per anni