Download Queste statistiche in altri paesi:
Linea del tempo:
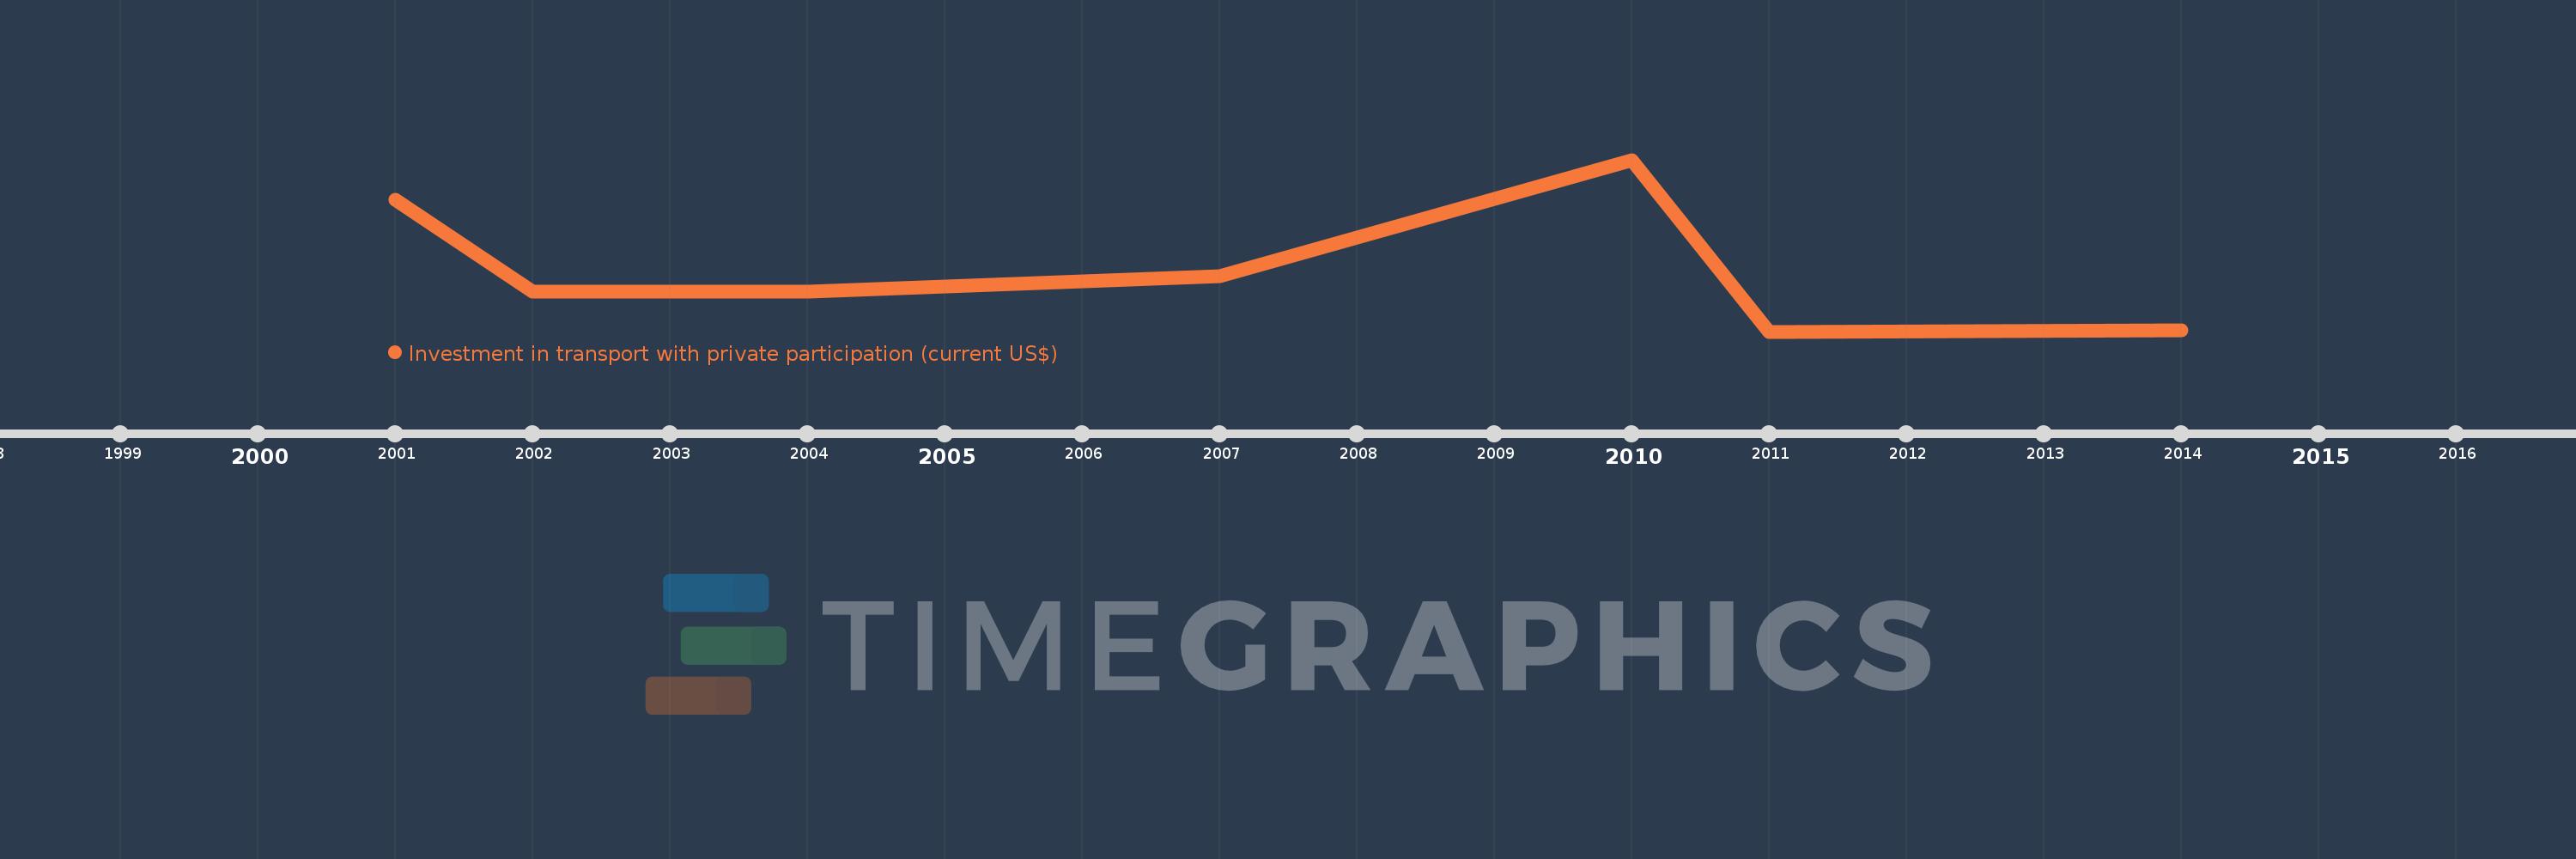
Questa scala temporale mostra un grafico dal 2001 anno al 2014 anno. Dominican Republic. I dati fino ad 2000 anno non disponibili. Il numero di osservazioni attuali secondo i date: 7.
La fonte (nome):
Indicatori dello sviluppo mondiale
La fonte (organizzazione):
World Bank, Private Participation in Infrastructure Project Database (http://ppi.worldbank.org).
Categorie:
Infrastructure, Private Sector
sono stati aggiornati
23 apr 2017 anni
Indicatori delle variazioni dei valori per anni
Minima:
69.0 Mln
1 gen 2011 anni
Massimo:
629.9 Mln
1 gen 2010 anni
Alla data di osservazione
Valore
Variazione assoluta
La variazione rispetto al valore precedente
1 gen 2001 anni
498.9 Mln
+498.9 Mln
0.0%
1 gen 2002 anni
200.0 Mln
-298.9 Mln
-59.91%
1 gen 2004 anni
200.0 Mln
0.0
0.0%
1 gen 2007 anni
250.0 Mln
+50.0 Mln
25.0%
1 gen 2010 anni
629.9 Mln
+379.9 Mln
151.96%
1 gen 2011 anni
69.0 Mln
-560.9 Mln
-89.05%
1 gen 2014 anni
73.4 Mln
+4.4 Mln
6.38%
Classificazione dei paesi secondo i statistiche attuali per anni