Download Queste statistiche in altri paesi:
Linea del tempo:
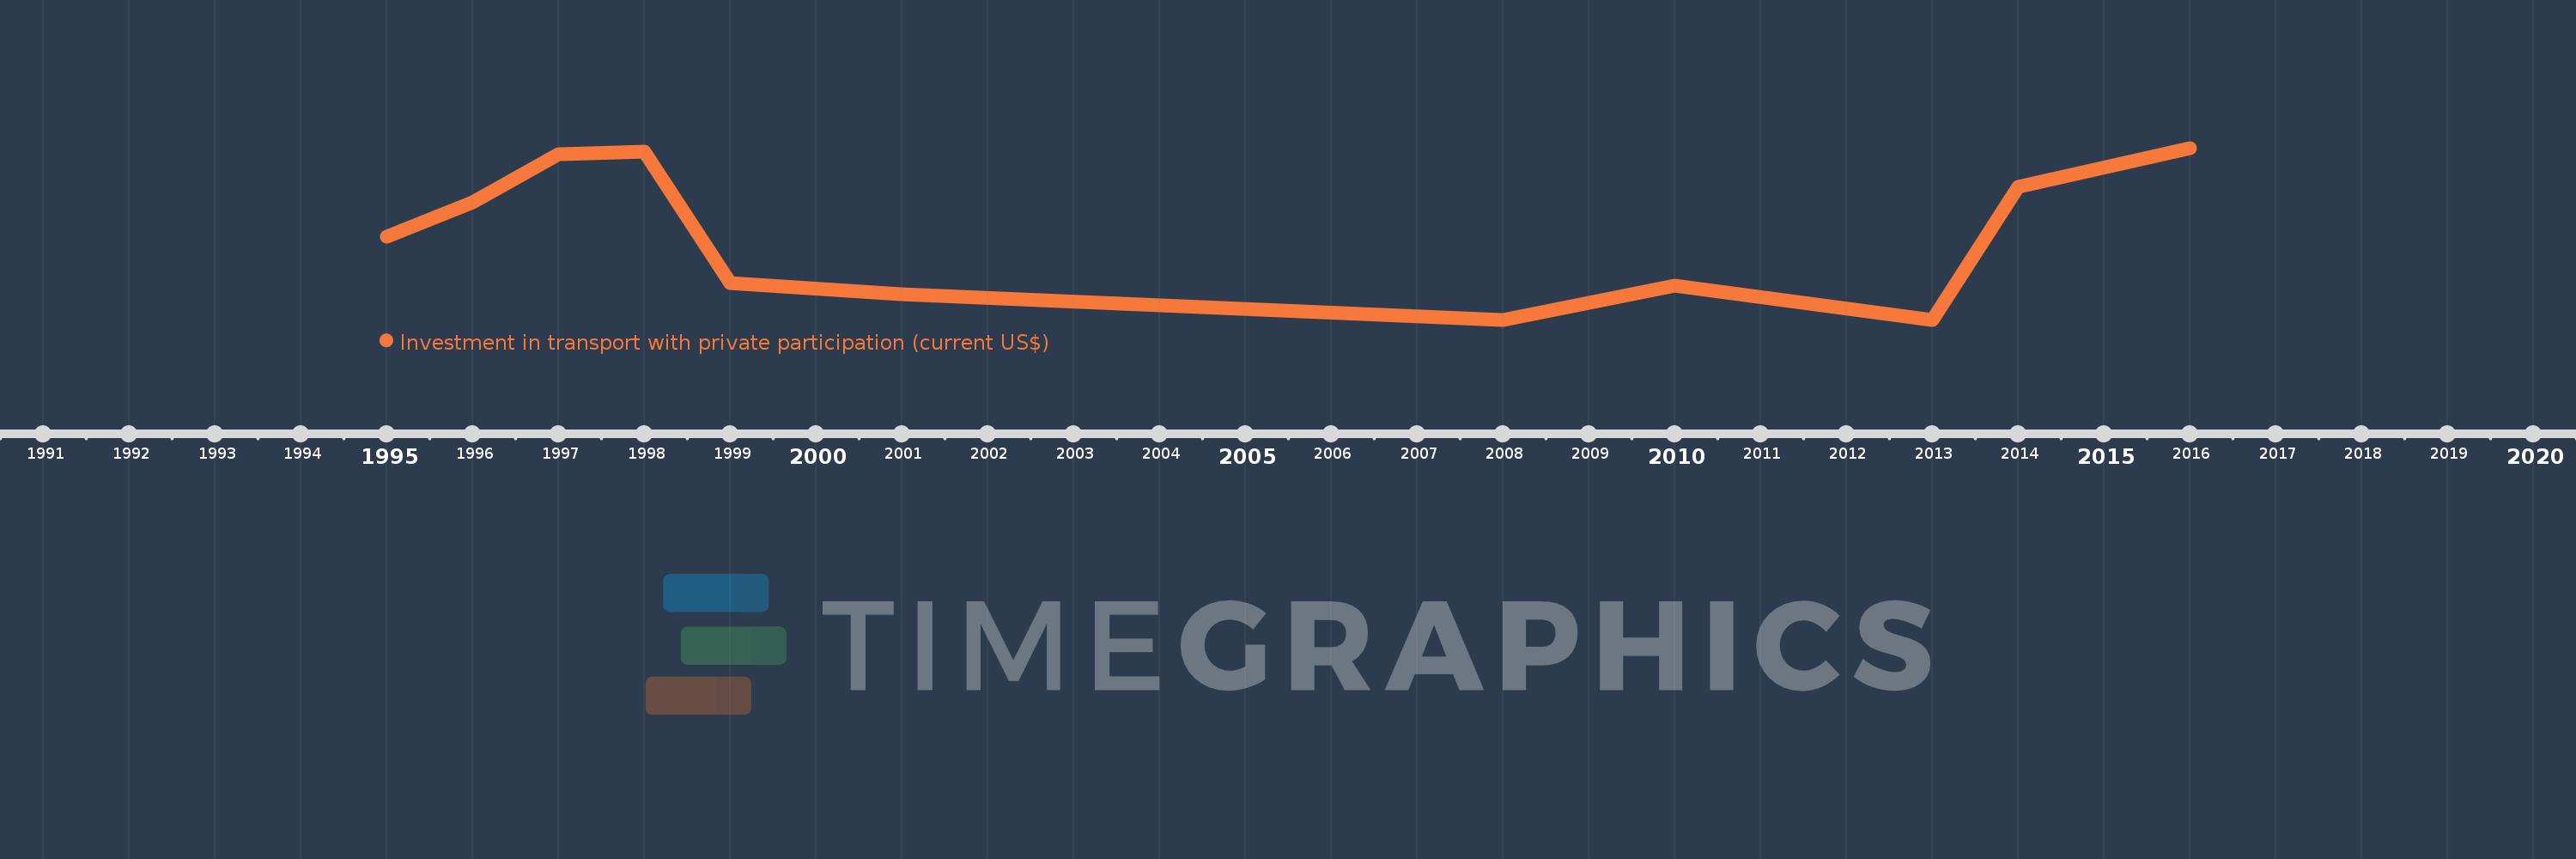
Questa scala temporale mostra un grafico dal 1995 anno al 2016 anno. Panama. I dati fino ad 1994 anno non disponibili. Il numero di osservazioni attuali secondo i date: 11.
La fonte (nome):
Indicatori dello sviluppo mondiale
La fonte (organizzazione):
World Bank, Private Participation in Infrastructure Project Database (http://ppi.worldbank.org).
Categorie:
Infrastructure, Private Sector
sono stati aggiornati
23 apr 2017 anni
Indicatori delle variazioni dei valori per anni
Minima:
0.0
1 gen 2008 anni
Massimo:
350.0 Mln
1 gen 2016 anni
Alla data di osservazione
Valore
Variazione assoluta
La variazione rispetto al valore precedente
1 gen 1995 anni
169.9 Mln
+169.9 Mln
0.0%
1 gen 1996 anni
240.0 Mln
+70.1 Mln
41.26%
1 gen 1997 anni
337.0 Mln
+97.0 Mln
40.42%
1 gen 1998 anni
342.6 Mln
+5.6 Mln
1.66%
1 gen 1999 anni
75.0 Mln
-267.6 Mln
-78.11%
1 gen 2001 anni
51.4 Mln
-23.6 Mln
-31.47%
1 gen 2008 anni
0.0
-51.4 Mln
-100.0%
1 gen 2010 anni
70.0 Mln
+70.0 Mln
%
1 gen 2013 anni
0.0
-70.0 Mln
-100.0%
1 gen 2014 anni
270.0 Mln
+270.0 Mln
%
1 gen 2016 anni
350.0 Mln
+80.0 Mln
29.63%
Classificazione dei paesi secondo i statistiche attuali per anni